
Content navigation

For us, the reporting season is about unpacking the impact of heightened news flow from companies via their results and our engagements with boards and management on our long-term Valuations. Are fundamentals still being left behind on the platform this reporting season, or does the shift in factors driving market returns, macro themes and management tone suggest that valuations, earnings, and prices are starting to realign?
In our latest reporting season wrap, we unpack how company results, and our board and management engagements, are hinting that the market may finally be ready to change track -- towards Value style investing again.
Key takeaways:
- There has been a stark gap between market prices and company fundamentals for some time, with growth & momentum factors, and large index flows, dominating returns and causing bubble-like conditions.
- Dominant factors driving Australian returns over the past year reversed during February, coinciding with Reporting Season month. The price reaction to results suggests a shift in market sentiment back toward company fundamentals, and narrowing the gap between earnings, prices and valuations.
- However, the growing impact of index-related flows is causing significant price swings for large-cap stocks, even with minimal news.
- On a micro level, companies are moving past external challenges and have greater confidence in growing their businesses. Persistent inflation, higher for longer bond yields, and changing equity-bond correlations suggest a broader macro shift that will support Value-style investing.
- Extreme valuation spreads suggest strong potential alpha for Value stocks, similar to past market cycles following the tech bubble, GFC and Covid. The Value opportunity is concentrated in high-quality, undervalued defensive stocks that can essentially provide investors both upside potential and downside mitigation.
- Value-style focussed strategies have begun 2025 on a very strong footing. While it is difficult to pick an exact turning point for valuation spreads to narrow, we believe that now is the time for investors to evaluate if they have enough Value-style exposures in their portfolios for the opportunity on offer, be it through high conviction Value or other fundamental, valuation-led strategies.
- Importantly, the end of bubble-like conditions allows the stock fundamentals of our portfolio holdings to shine through, and more opportunity to create value from the kind of turnover that can drive strong alpha.
-
We are able to compare and contrast the efficacy of various market factors and also our fundamental research lenses to better understand what is driving the returns of the market, and this has highlighted that drivers of returns over the reporting month of February were very different to the last 12 months.
Analytical review of results and revisions
For us, the reporting season is about unpacking the impact of heightened news flow from companies via their results and our engagements with boards and management on our long-term Valuations.
Every reporting season we use our analysis of the drivers of how company results came in compared to consensus broker expectations (surprise), the extent to which these brokers revised their forecasts for earnings in the next 12 months (revisions), and how stock prices reacted to that news to judge the overall pulse of the market more logically and better understand the real fundamental drivers of the price response.
Earnings results = a passing grade for the first time in some time
Across the S&P/ASX 200 stocks we cover, sales and earnings surprise, or how the actual results came in vs. the prereporting broker consensus forecasts, was line-ball positive this season, with a more positive surprise for dividends.
Sales surprise
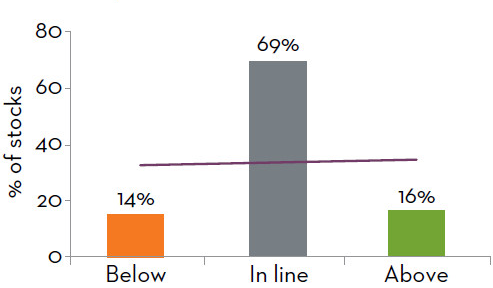
EPS surprise
DPS surprise
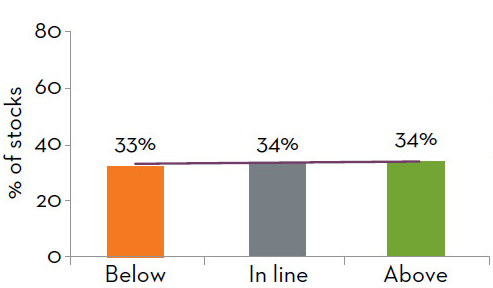
In terms of revisions by brokers post the announcement of results, we saw a positive skew towards upgrades across each of the sales, earnings and dividend lines. While the earnings skew doesn't look that large on our metrics, as the last five reporting season periods had been skewed well towards the negative, this is a welcome change.
Sales revision
EPS revision
DPS revision
An important note to consider with this data is that we calculate our scorecard on an equal-weighted basis rather than market-cap weighted, to remove the impact that the large index weights, particularly the miners, have on the data. Given falling commodity prices, market-cap weighted results would have been a bit worse. have been a bit worse.
Deep dive on market reaction
Market conditions flipped in February
As an active fundamental manager, we have been looking for signs of a price and earnings re-connect for some time as this would provide more opportunity for us to use our differentiated fundamental insights to generate alpha.
We are able to compare and contrast the efficacy of various market factors and also our fundamental research lenses to better understand what is driving the returns of the market, and this has highlighted that drivers of returns over the reporting month of February were very different to the last 12 months.
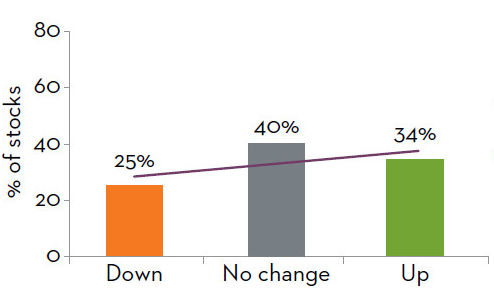
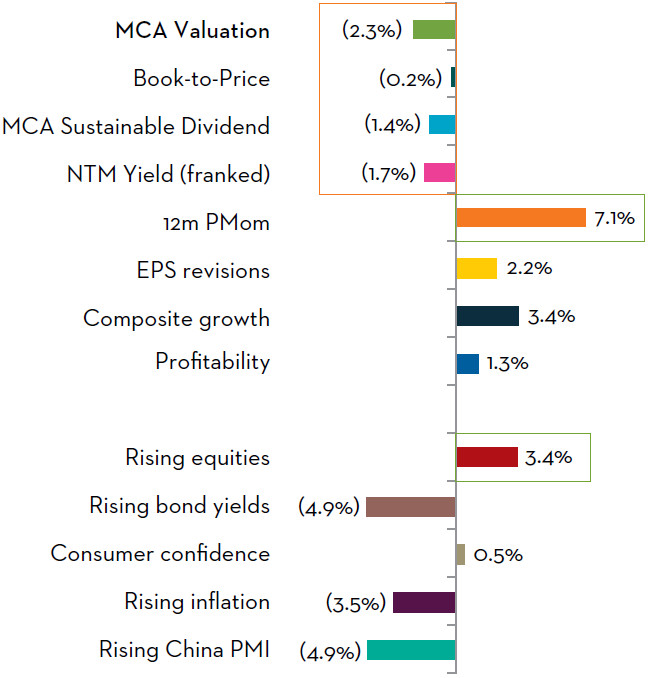
- Over the last 12 months, Price Momentum had been the dominant factor, and as such it has been a difficult environment for valuation and income factors (for both our internal MCA lenses and also traditional factors).
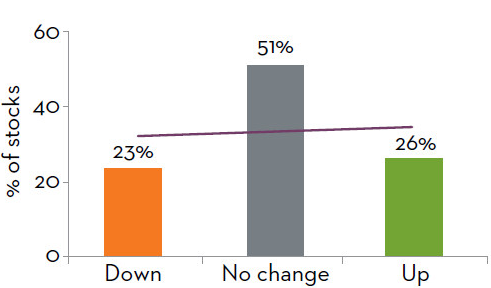
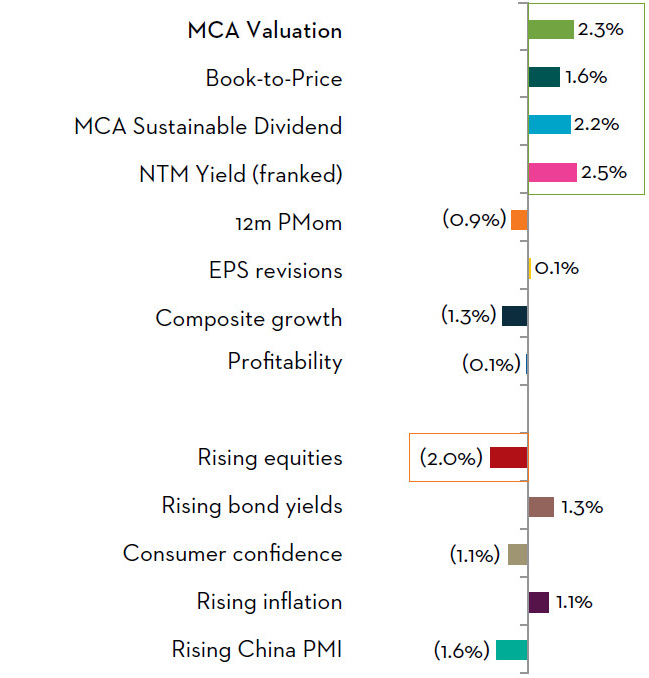
The market had also favoured stocks that are exposed to rising equity markets. - In the month of February, we saw a full reversal of factors, with valuation and income now doing well, and Momentum doing poorly, and those names exposed to rising equity markets underperforming.
S&P/ASX 200: 12-month risk premium
S&P/ASX 200: 1-month risk premium
Price reaction = different by style and sentiment
When we look specifically at how share prices reacted to results and revisions during February, we also saw a marked change in the market behaviour, making us feel like the momentum-driven, large-cap days might be behind us.
Compared to recent seasons:
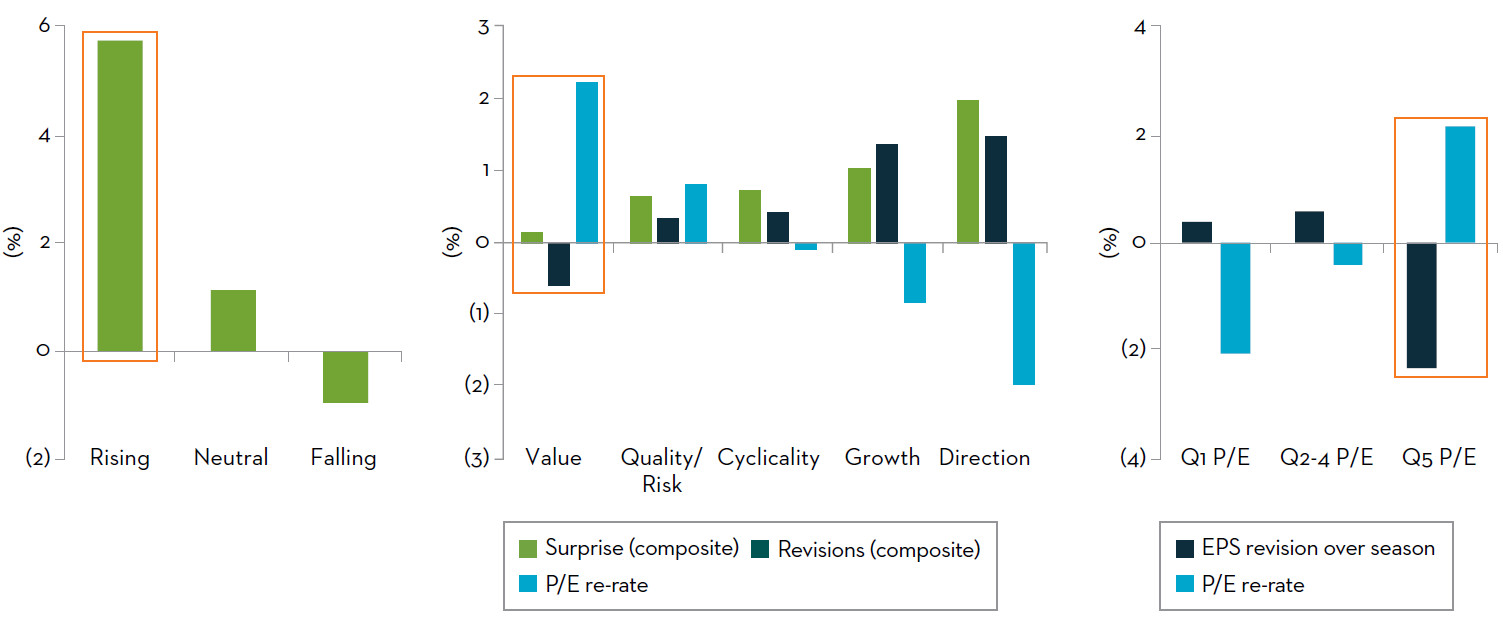
- Stocks with increasing level of shorts coming into the season had on average, a positive price reaction relative to the S&P/ASX 200 in the two days post result.
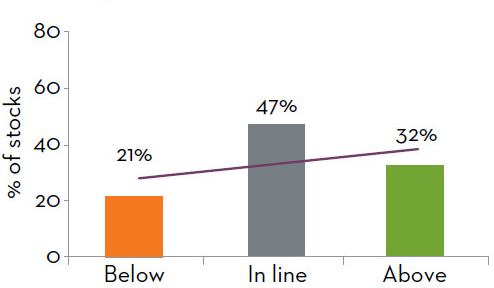
- Typical Value-style stocks saw in-line earnings results, and slightly negative earnings revisions, but a strong price reaction. In contrast, Growth stocks and those with strong momentum/direction coming into the results, delivered more on earnings and had upgrades, but their price reaction was quite poor.
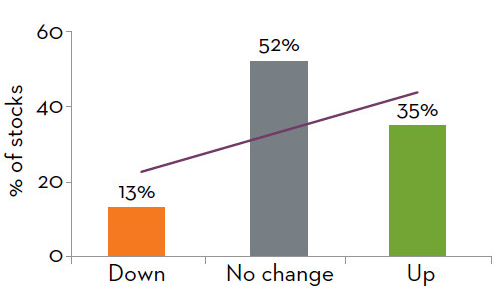
- Bundling this into quintiles, the most expensive stocks on a P/E basis (Q1) did have modest earnings upgrades, but their P/E ratio fell (i.e., price fell more than earnings rose). The cheapest names (Q5) saw earnings downgrades, but they had a stronger P/E improvement (price rose more than earnings fell).
2-day price reaction: by shorted stock level
Average change: by style category
Average change: by P/E quintile
Volatile large caps
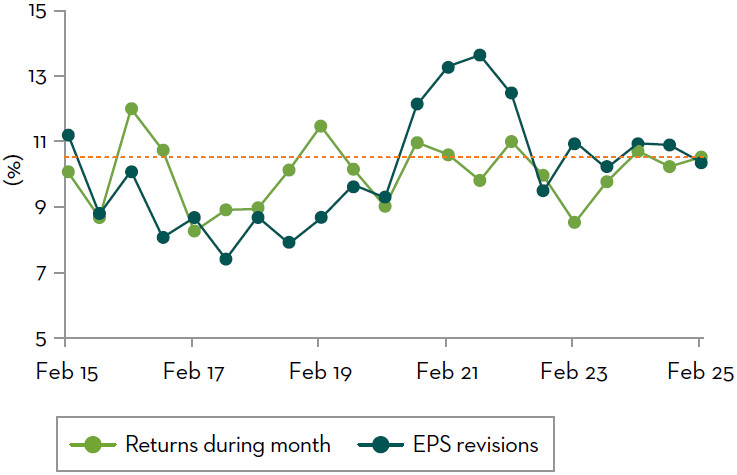
Another thing that we noted outside of expectations this period was the volatility of earnings and prices during the results month.
Earnings revisions and prices have tended to be quite volatile around crisis periods like Covid and economic uncertainty. Despite the choppy conditions, the variability in both metrics was relatively normal this season and was not particularly volatile.
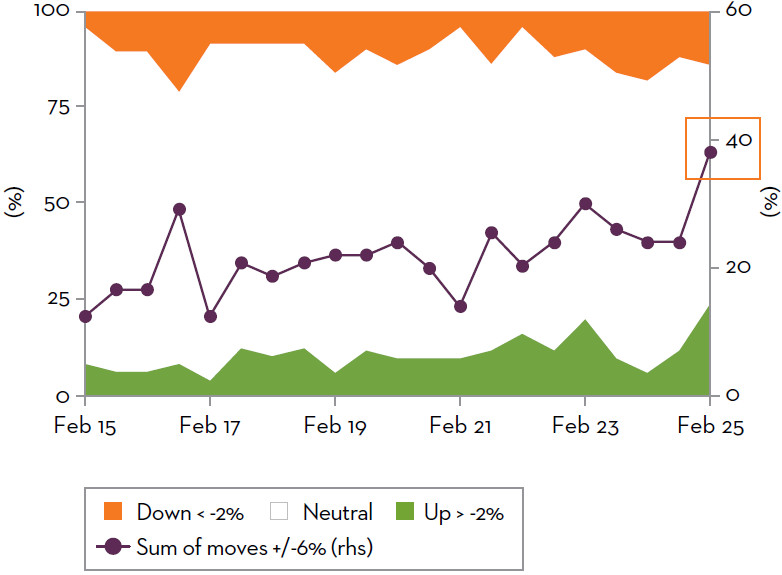
However, when we drilled down into it a bit more, we found two things stood out. The volatility was there, it was just hiding in the two-day price reaction, rather than the returns over the full month.
Cross sectional variance of returns and revisions: S&P/ASX 200
2-day price reaction for +/-2% EPS revision
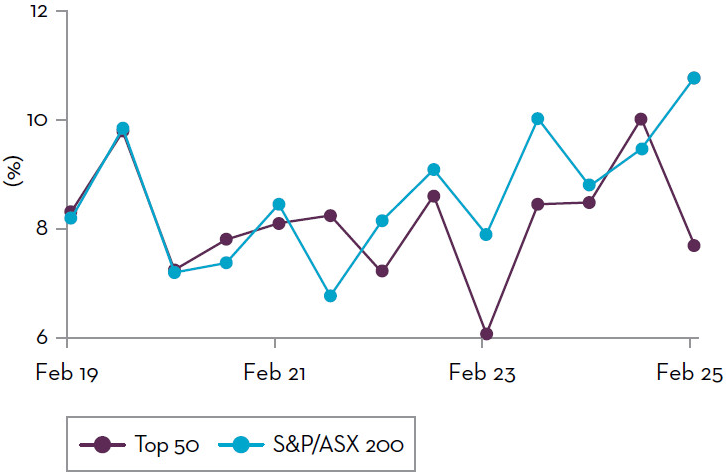
And within that, the largest moves, both up and down, over the two days post result were in the top 50 stocks, not across the whole S&P/ASX 200, with 40% of top 50 stocks having a price reaction of more than +/-6% vs. the index.
As a result, large stocks also generally did poorer than small companies on earnings and price reaction.
2-day price reaction: S&P/ASX Top 50
Special analysis on the growing impact on indexing
Index friction creating mispricing and potential active alpha
Looking at reasons for this, one that stands out as a potential culprit is the growing impact on the Australian market of index related flows, be it passive investing, or superannuation funds focused on Your Future Your Super (YFYS) and hugging the performance test index.
We have recently completed new analysis that measures the percentage of daily stock turnover that can be attributed to index buying. In aggregate, we have calculated that more than 25% of daily turnover for certain stocks is currently related to index/passive/ETFs, compared with less than 15% during the previous decade.
Why does this matter? In normal circumstances, when the market sees new information on a stock, such as earnings result surprise, or a key macro change, the volume of shares traded would increase. As a result, the impact of index buying in setting the price should diminish, overpowered by the trading based on the new information.
However, with the increased weight of index buying, what we have found is that a phenomenon we are calling ‘gap pricing’ is becoming more profound.
This is where prices and index weights of the top 50 stocks have run up due to passive or index related flows, but the volume of shares traded has dropped – investors are buying and holding to keep closer to index. This then means that small levels of negative information can cause large price reactions.
2-day price reaction vs. EPS revisions: Top index flow stocks
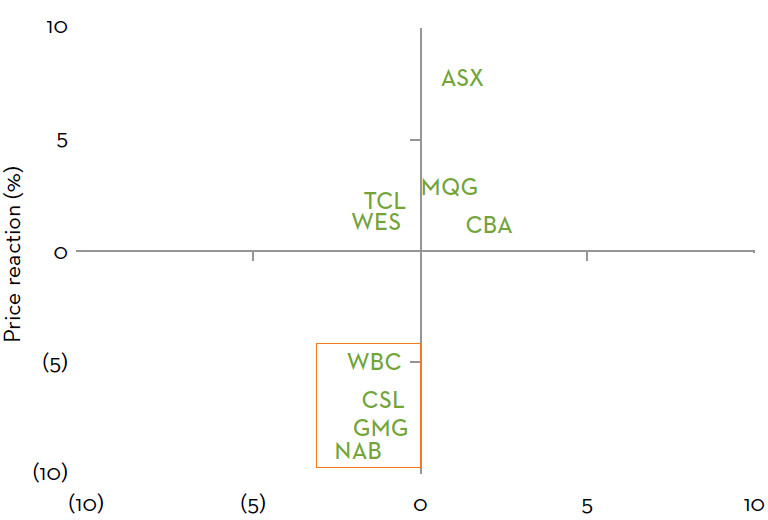
This reporting season, we saw this with National Australia Bank, Goodman Group, CSL and Westpac Banking Corporation who had very minimal earnings downward revisions, i.e., very little incremental information, but had a near -10% two-day price reaction.
While it didn’t have a large two-day price reaction to its results (they were slightly positive), Commonwealth Bank of Australia is another stock that fits in the high index buying bucket, and it did start to fall later in February. We wrote about the danger that unwinding euphoria around the stock could cause to index hugging portfolios in detail in a recent blog article.
For an active manager like us, understanding this kind of inefficiency/friction can create alpha opportunities.
Index flows also impact capital management
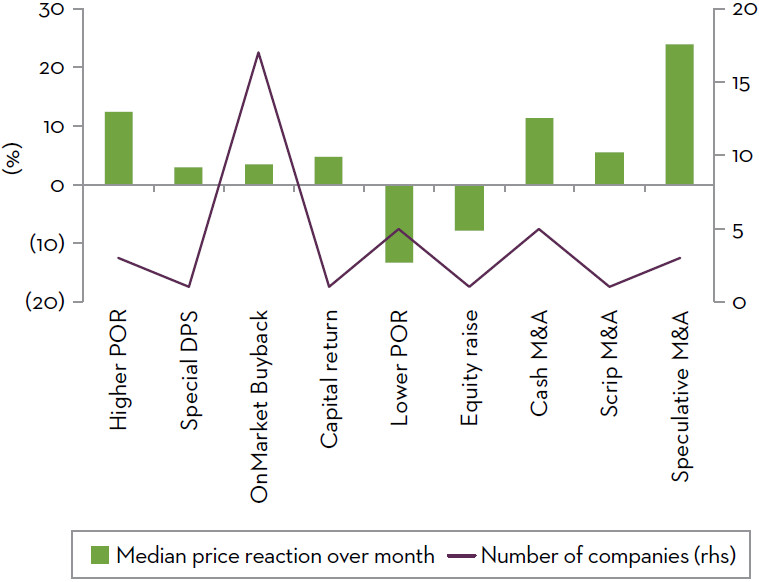
We have seen plenty of capital management activities this season leading to positive price reaction.
One thing we will no longer see is the beloved offmarket buyback. With that avenue now closed to companies, instead we saw more than 15 companies running on-market buybacks given they have either excess capital or they view their stock as particularly cheap.
Capital management activities
On the theme of index flows above, we are also seeing this change the capital management behaviour of companies, with Light & Wonder looking at redomiciling the majority of its index weight from the US to Australia so they can benefit from increased index flows.
Key fundamental themes from engagement
Less externalities, more internal confidence…
Back to the fundamentals and looking at the broad themes that have come out of management guidance and our meetings and engagements with company management teams, we are seeing a slightly different ‘tone’ to the last few seasons.
Previously, companies seemed to be focussed on how externalities were negatively driving their results. Management now seem more confident to talk about business growth and investing more in their business. Management guidance from companies suggested that the consumer is still finding it tough – they are still bargain hunting and trading down from ‘premium’ to ‘everyday value’ – but companies are now just getting on with it.
What was interesting was what didn’t make the top of the list this season but had been important in the past - labour and energy costs, shortages in supply chains, FX (given the weak AUD), tariffs. We have certainly seen that the labour market pressures have normalised with government big build programs coming to an end and no longer crowding out labour resources.
Cost pressures are now a tailwind. With tariffs, most companies talked about either flexing production on where they produce or making the consumer pay. One other large reaction we saw in Australia to the Trump campaign was the step away from Net Zero and science-based targets. We covered this in more detail in a recent blog article based on a survey we undertook of ASX-listed companies late last year.
In terms of China, there is an overcapacity in steel and China needs to rebalance that market with capacity closures. There is a general concern that this could have a negative impact on demand, pushing out the high-cost producers. Market sentiment towards China will be very positive if the proposed stimulus is significant. In terms of the lithium and rare earth space, demand and production for EVs is still growing strongly, but it is not clear if any positive sentiment is going to translate into material demand improvement for Australia.
…but macro regime may signal a bigger change
Stepping back however, it is impossible to ignore the changes in the macro environment that have seemed to gather influence in the first 50 days since President Trump’s second inauguration and which coincided with the months’ worth of Australian companies’ earnings reports.
- Evidence of inflation and bond yields staying “higher for longer” has become more widespread;
- Concern surrounding the impact of higher tariffs on the US consumer has reduced optimism on the outlook for US and global growth; and
- The reversal of two decades worth of negative equity / bond return correlations.
All of these point to a change in the macro environment that could foreshadow a change which could benefit Value style investing.
Market outlook
Closing the gap between price and earnings: Narrowing valuation spreads
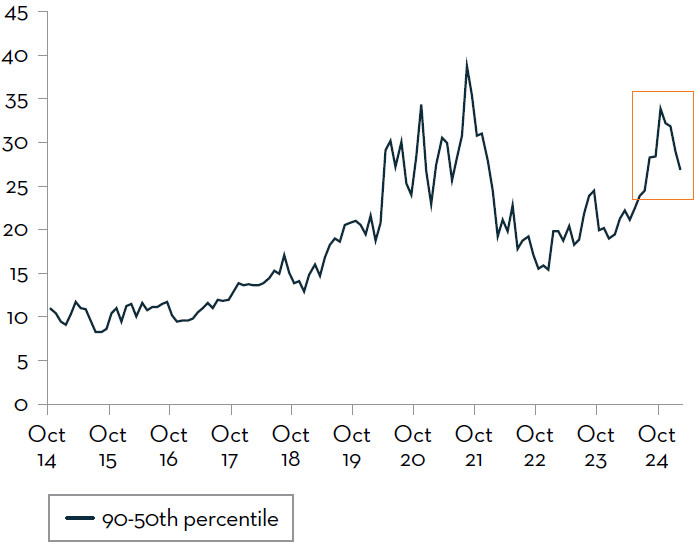
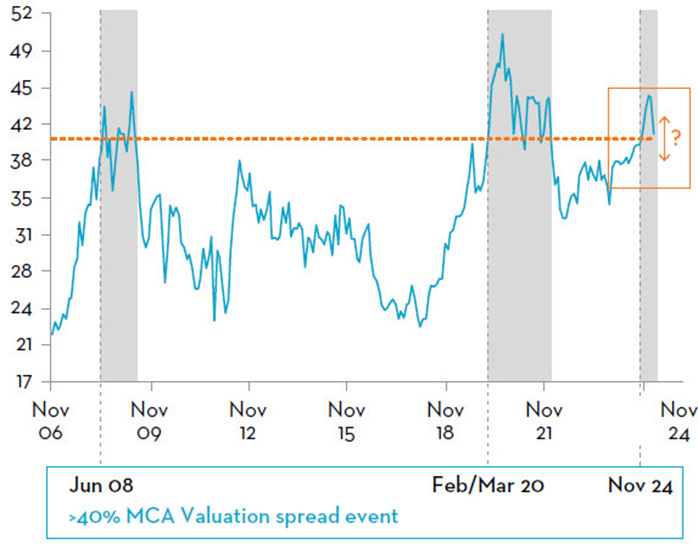
On a valuation basis, the gap (dispersion) between the P/E ratios of the cheapest socks and most expensive stocks in the market has been in extreme territory for some time. Our proprietary ‘MCA Valuation Spread’ measure -- which uses the bottom-up analysis of our team and shows how cheap the stocks that we use to build our MCA Value Equity portfolios (such as the Martin Currie Select Opportunities Fund) are compared to the rest of the market -- is also highlighting that we are facing similar extreme conditions last seen in the Tech bubble, Global Financial crisis and Covid crisis. These spread peaks have all preceded large Value-style return rebounds.
P/E dispersion
MCA Valuation Spread
Value stocks produce significant alpha after elevated spread events
It is very hard for fundamental-focussed Value managers to have strong performance while valuation spreads are widening, as this means that expensive stocks are rising, and cheap stocks are getting cheaper. But they cannot remain at such elevated levels indefinitely.
To us, the factors driving market returns and the sentiment change during February’s reporting season is a sign that prices are reconnecting with earnings and fundamentals and that wide valuation spreads will soon begin to narrow. In fact, in February our MCA Value Equity portfolios (including the Martin Currie Select Opportunities Fund) have already returned significant alpha vs. the S&P/ASX 200 Acc. index.
Of course, one month of good performance does not make a full rebound, and there is still a very large disparity remaining between the price for cheap stocks and expensive stocks in the market. History has shown us that as valuation spreads narrow, they can mark the beginning of extraordinary outperformance for Value investors for the next 12-18 months.
Value stocks should offer a safety net
Growth managers may suggest that enduring high valuation spreads between cheap and expensive names is justified. They refer to the ‘growth scarcity’ in the Australian market, and that in a decelerating profit growth environment, the cheapest part of the market would have weaker earnings growth and the organic structural ‘growers’ will maintain their earnings growth. They would say that investors should pay a premium for that.
However, there is no clear path for the future earnings direction of Australian companies at this point. An acceleration in interest rate cuts would help the consumer, and China stimulus would assist miners. But the US tariff wars are creating a lot of uncertainty which we think would be ‘stagflationary’.
No matter the direction, we believe that the opportunity for Value is twofold. An economic acceleration can be good for Value as this growth scarcity gap would reduce. On the other hand, an economic deterioration can be good as the Value opportunity is concentrated in low-beta and higher-quality names.
What we mean by this is that the lower-risk, low-beta stocks can essentially provide investors both upside potential and downside mitigation. And that can produce great outcomes in times of market volatility. This makes the characteristics of the current extreme valuation spread more akin to the conditions of the Tech bubble than the more-risky crisis conditions of the GFC and Covid.
Strategic positioning for the conditions
High conviction Value
The changing valuation conditions over the recent period have allowed us to be far more active in our Value Equity portfolios (including the Martin Currie Select Opportunities Fund), and we expect this heightened trading activity to continue as higher valued and risky names come back to earth.
We are particularly excited about the quality and diversification of undervalued Australian stocks available today. In these portfolios, we are currently overweight (vs. S&P/ASX 200) what we believe to be the most attractively valued, high-quality defensive businesses including Medibank Private, ANZ Group Holdings, QBE Insurance Group, Aurizon Holdings, and AGL Energy, while maintaining underweight positions in fully valued/expensive names such as Commonwealth Bank of Australia and CSL.
- Medibank Private is a great example of a defensive, attractively valued stock that we have held for some time hold across multiple strategies. This season it reported stronger earnings growth and delivered good results for the period and upgraded its earnings outlook to around 15% p.a.
- We also recently added Woolworths Group to the portfolio, a company with a strong market position in a stable industry. While its stock price has been subdued after it lost ground to Coles, we see it as a defensive Value opportunity. The new management is looking to refocus on its core strategy, which should see it regain its old lustre.
Multiple ways to capitalise on the opportunity
Given the size of the Value opportunity, we believe that all investors who believe in fundamental, valuation-led stock picking can benefit, even those facing strict performance and risk benchmarks or those that have specific Sustainability requirements.
Our high conviction Value Equity portfolios share several key value opportunity overweights, such as Medibank Private, with our more customised strategies:
- Our Active Insights strategy (available via the Martin Currie Active Insights Fund) is a risk-managed strategy combining fundamental analysis with quantitative techniques to capture value opportunities while minimising sector and style risks; and
- Our Sustainable Equity strategy (available via the Martin Currie Sustainable Equity Fund) aims to create long-term value for investors through an actively managed selection of companies which have been assessed using our proprietary approach for understanding sustainability and financial attributes.
A high-quality defensive stock like Medibank Private is also a key holding for our income-focussed strategies due to its attractive franked dividend yield:
- Our Equity Income strategy (available via the Martin Currie Equity Income Fund) aims to meet the income needs of investors such as retirees by providing a consistent and growing income stream through an actively managed selection of high-quality companies, favouring those that are highly franked dividend payers.
- Our Sustainable Income strategy (available via the Martin Currie Sustainable Income Fund) combines this unique approach that aligns with the income needs of retirees with our proprietary approach for understanding sustainability and financial attributes and client ethical values.
While it is difficult to pick an exact turning point in valuation spreads, we believe that now is the time for investors to evaluate if they have enough Value-style exposures in their portfolios for the opportunity on offer.
Definitions
Key definitions used in our top-down analytical review
Surprise: companies where there is a >+/-2% difference between company reported results and broker consensus forecasts on a specific measure.
Surprise (composite): average difference between company reported results and broker consensus forecasts for Sales, EBITDA, Earnings per share (EPS), Dividends per share (DPS) and Cashflow per share (CFPS). forecasts on a specific measure.
Revisions: companies with a +/-2% change in broker consensus next 12-month (NTM) forecasts after companies have reported their results on a specific measure.
Revisions (composite): average change in broker consensus next 12-month (NTM) forecasts after companies have reported their results for Free Cashflow (FCF), Debt/Equity, EPS and DPS.
Price reaction: difference between company reported results and the S&P/ASX 200 Accumulation index over specified time period.
Shorted stock level: +/-0.5% change in short interest level. A rising number means increased shorting.
P/E re-rate: change in Price/Earnings (P/E) ratio during reporting season month.
Risk premium: denotes the average return associated with a one standard deviation change for an MCA lens’ signal score or Fama-French-Carhart or other factor score. Positive and larger risk premia indicate better efficacy. These numbers do not represent the performance of an actual portfolio and should not be considered as an indication of future returns.
Disclaimers for data and content throughout
Past performance is not a guide to future returns.
Unless otherwise noted, data is calculated using the weighted average of broker consensus forecasts of each portfolio holding – because of this, the returns quoted are estimated figures and are therefore not guaranteed and may differ materially from the figures mentioned. The figures may also be affected by inaccurate assumptions or by known or unknown risks and uncertainties.
For broker consensus data, the number of brokers included for each individual stock will depend on active coverage of that stock by a broker at any point in time. A median of brokers is typically utilised. All estimates avoid stale forecasts which are removed after a certain number of days.
Portfolio data is presented for relevant representative Martin Currie Australia (MCA) representative accounts as marked. Returns are shown in A$ gross of management fee.
Any information provided should not be considered a recommendation to purchase or sell any particular security. It should not be assumed that any of the security transactions discussed here were, or will prove to be, profitable.
Important Information
This publication is issued for information purposes only and does not constitute investment or financial product advice. It expresses no views as to the suitability of the services or other matters described in this document as to the individual circumstances, objectives, financial situation, or needs of any recipient. You should assess whether the information is appropriate for you and consider obtaining independent taxation, legal, financial or other professional advice before making an investment decision.
Neither MCA, Franklin Templeton Australia, nor any other company within the Franklin Templeton group guarantees the performance of any Fund, nor do they provide any guarantee in respect of the repayment of your capital.
The document does not form the basis of, nor should it be relied upon in connection with, any subsequent contract or agreement. It does not constitute, and may not be used for the purpose of, an offer or invitation to subscribe for or otherwise acquire shares in any of the products mentioned.
Past performance is not a guide to future returns.
The distribution of specific products is restricted in certain jurisdictions, investors should be aware of these restrictions before requesting further specific information.
The views expressed are opinions of the portfolio managers as of the date of this document and are subject to change based on market and other conditions and may differ from other portfolio managers or of the firm as a whole. These opinions are not intended to be a forecast of future events, research, a guarantee of future results or investment advice.
Some of the information provided in this document has been compiled using data from a representative account. This account has been chosen on the basis it is an existing account managed by MCA, within the strategy referred to in this document. Representative accounts for each strategy have been chosen on the basis that they are the longest running account for the strategy. This data has been provided as an illustration only, the figures should not be relied upon as an indication of future performance. The data provided for this account may be different to other accounts following the same strategy. The information should not be considered as comprehensive and additional information and disclosure should be sought.
The information provided should not be considered a recommendation to purchase or sell any particular strategy / fund / security. It should not be assumed that any of the securities discussed here were or will prove to be profitable. It is not known whether the stocks mentioned will feature in any future portfolios managed by MCA. Any stock examples will represent a small part of a portfolio and are used purely to demonstrate our investment style.
The analysis of Environmental, Social and Governance (ESG) factors forms an important part of the investment process and helps inform investment decisions. The strategy/ies do not necessarily target particular sustainability outcomes. Risk warnings - Investors should also be aware of the following risk factors which may be applicable to the strategy shown in this document.
- Investing in foreign markets introduces a risk where adverse movements in currency exchange rates could result in a decrease in the value of your investment.
- This strategy may hold a limited number of investments. If one of these investments falls in value this can have a greater impact on the strategy’s value than if it held a larger number of investments.
- Smaller companies may be riskier and their shares may be less liquid than larger companies, meaning that their share price may be more volatile.
- The strategies mentioned may invest in derivatives (index futures) to obtain, increase or reduce exposure to underlying assets. The use of derivatives may restrict potential gains and may result in greater fluctuations of returns for the portfolio. Certain types of derivatives may become difficult to purchase or sell in such market conditions.
- Income strategy charges are deducted from capital. Because of this, the level of income may be higher but the growth potential of the capital value of the investment may be reduced.
Franklin Templeton Australia Limited as Responsible Entity has appointed Martin Currie Australia as the fund manager for the Martin Currie Select Opportunities Fund (ARSN 122 100 207, APIR SSB0009AU), Martin Currie Active Insights Fund (ARSN 673 996 720, APIR SSB2241AU), Martin Currie Sustainable Equity Fund (ARSN 088 668 820, APIR SSB0125AU), Martin Currie Equity Income Fund (ARSN 150 751 821, APIR SSB0043AU), and Martin Currie Sustainable Income Fund (ARSN 618 906 068, APIR SSB4946AU)
Please read the relevant Product Disclosure Statements (PDSs) and any associated reference documents before making an investment decision. In accordance with the Design and Distribution Obligations and Product Interventions Powers requirements we maintain Target Market Determinations (TMD) for each of our Funds. All documents can be found via www. franklintempleton.com.au or by calling 1800 673 776.