
Content navigation
Global leadership from emerging market (EM) tech companies will be instrumental in driving the growth of the asset class
- EM technology companies have experienced significant growth, evolving the shape of the asset class – it is now the dominant sector in EM
- The growth in the sector has been driven by high quality companies delivering earnings growth
- Consensus earnings growth expectations for EM technology remain high, with more attractive growth and valuations compared to nearest competitors, US technology
- The volume of innovation should support further growth in EM technology compared to other regions
Technology has grown to be the dominant sector in EM
Technology represents almost a quarter of the MSCI EM Index. It has almost doubled in size in since 2010 due to its positive performance and has been the best performing sector over the long term.1 This is reflective of the broader change in the shape of the asset class over the past 15 years. EM are no longer dominated by commodities and cyclicals – the asset class has global technology leaders that offer innovative products and services, as well as domestic companies which are capitalising on enhancements in digitisation.
Evolution of EM sectors from 2010 to 2024
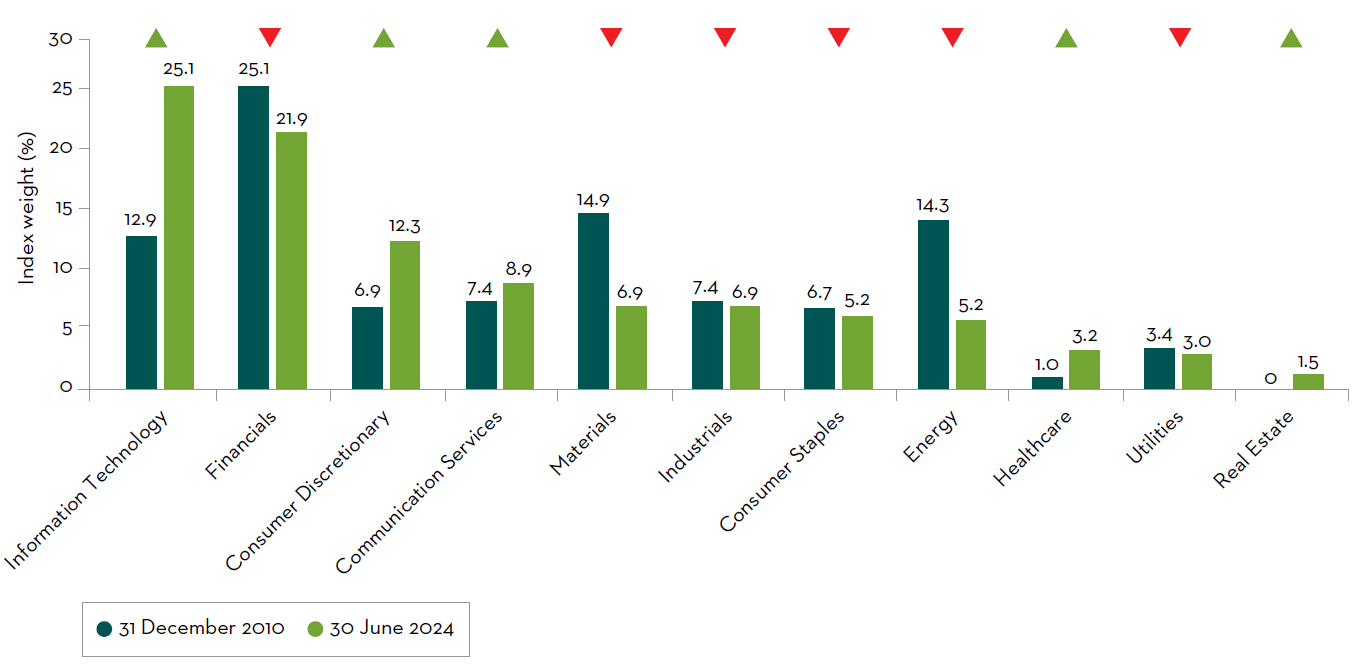
Source: FactSet, as of 30 June 2024.
-
Technology in EM has gone from strength to strength
A technology sector comprised of high quality and strong growth companies
The technology sector in EM has grown significantly over the past 10+ years, exhibiting higher and more consistent Returnson- Equity (ROE), while traditional sectors such as energy and materials, have shown structurally lower and more volatile returns. The net result is a significant upgrade in quality within the MSCI EM Index and is generally positive for the asset class.
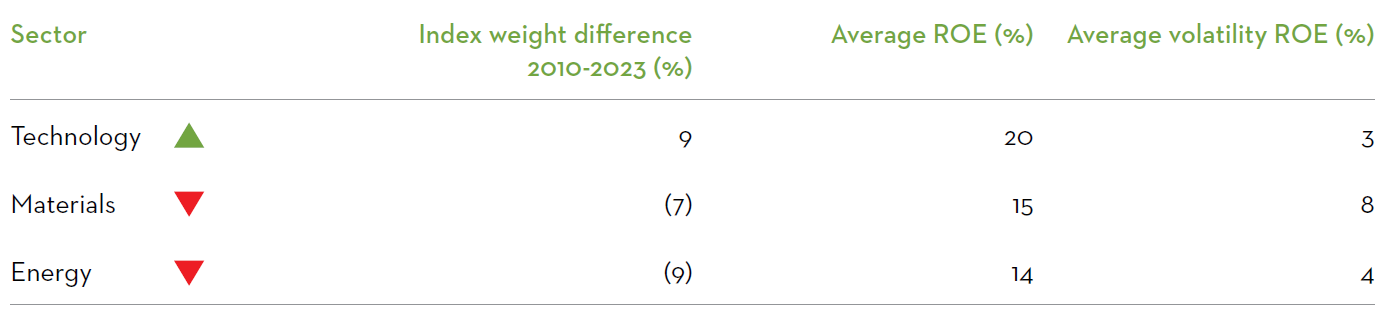
Source: Barra, MSCI Emerging Markets Index as of 31 December 2010 and 31 December 2023.
The technology sector is forecasted to deliver strong earnings as well. With cloud computing and the rise of artificial intelligence (AI), we believe we are at the beginning of another technology investment wave. Semiconductors will be at the forefront of this earnings super cycle with revenues being powered by growth in both volumes and pricing. AI investment is more memory intensive and the pricing of the AI offering is at a significant premium to traditional semiconductor endmarkets (i.e. handsets, PCs, industrial use).
MSCI EM technology price and earnings vs. MSCI EM
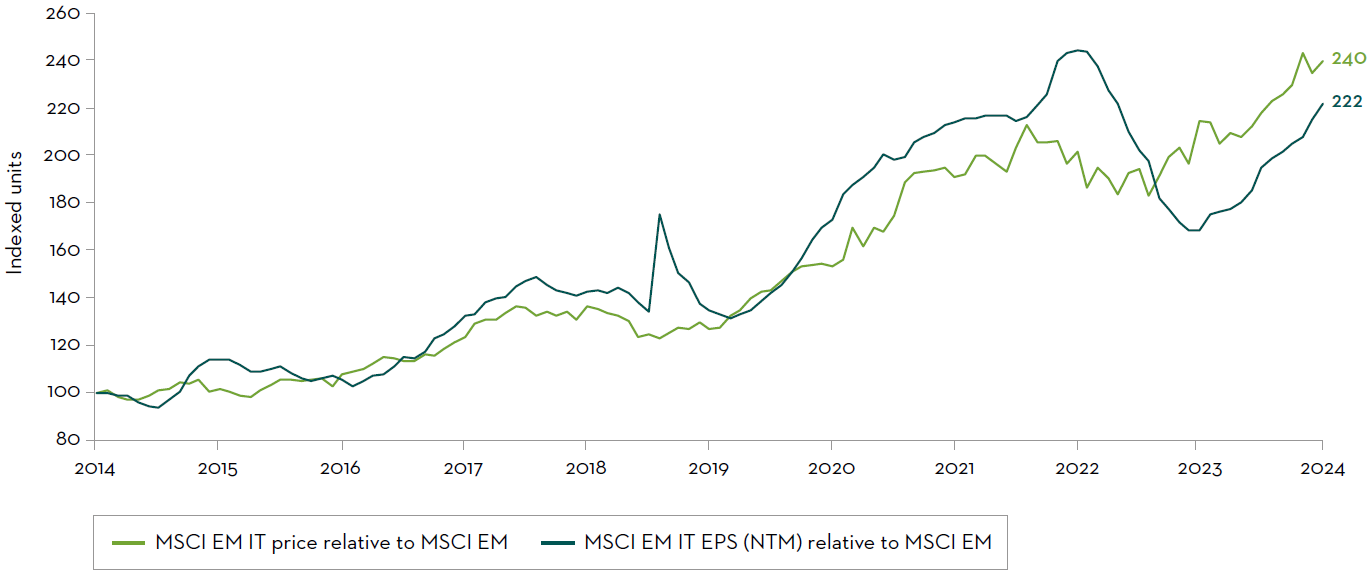
FactSet, as of 31 May 2024. Earnings per Share using Next Twelve Months (NTM) Earnings.
EM technology is set to continue compounding high returns and growth to close the valuation, reflective of its global leadership
The US technology industry has remained firmly in the headlines of mass-media with its recent strength and investors could certainly get exposure to the sector through the US market. We believe that this would be missing an opportunity though. EM technology offers higher growth at a lower valuation than the US, which is home to its nearest peers. With cloud computing and the rise of AI, we believe we are at the beginning of another technology investment wave. Earnings Per Share (EPS) growth over the next two years for EM technology is 45%. While the growth runway is impressive for EM technology, it trades at a ~40% discount to US technology with over double the earnings growth.
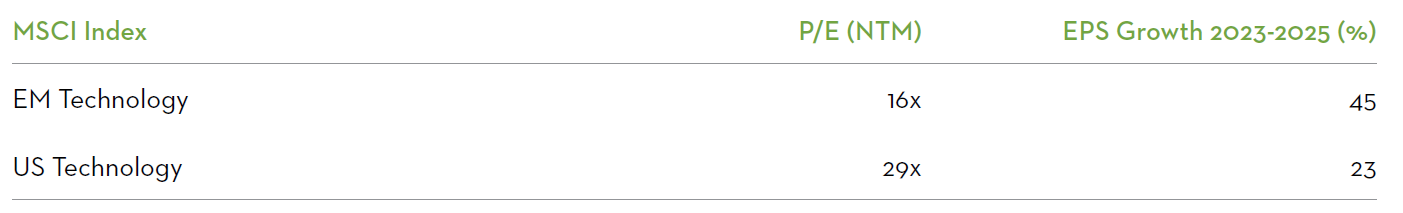
Source: FactSet as of 21 June 2024. Price-to-Earnings (P/E) using Next Twelve Months (NTM) Earnings and the Earnings per Share (EPS) Growth measured using the Compound Annual Growth Rate (CAGR) over two years from 2023 to 2025, for the MSCI Emerging Market Technology Index and MSCI US Technology Index.
With superior earnings growth, high quality, competitive valuation, and bigger weighting in the index, we believe that the sector’s contribution will be impactful in the years to come. We think the valuation gap between EM technology and US technology will close.
What makes EM technology so special?
There are more factors at play than simply an attractive price and individual company fundamentals. By exploring more unconventional sources of research, we can see that innovation is a core part of EM. Of the top 20 countries with the most patent applications in 2022, only half are developed market countries. The remainder are emerging and frontier markets. Half of the top six are key emerging market economies: China, Korea and India. These three countries alone represent half of the MSCI EM Index.2 The volume of applications in China alone is almost triple that of the US. The number of patent applications is just one indicator of thriving research/development in both private and public sectors. This suggests that the innovation runway within technology is strong for the years to come.
Largest 10 national patent offices with number of patent applications in 2022
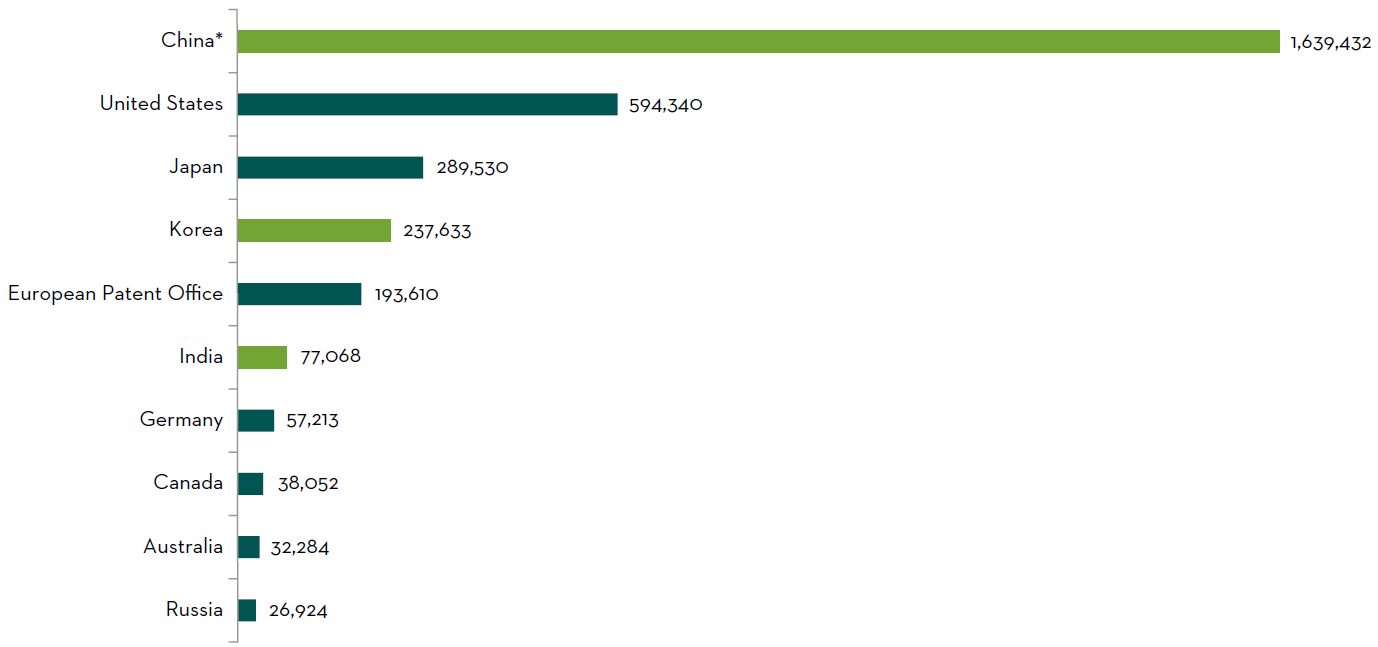
Source: Statista and World Intellectual Property Indicators as at November 2023. *China includes Hong Kong SAR.
Technology shaped the evolution of the EM landscape and is positioned to drive its strength in the coming years
Technology in EM has gone from strength to strength – it has evolved to be the most dominant sector in the index by consistently delivering on earnings. Compared to a decade ago, its index weight has doubled so now its relative contribution to index performance is even more impactful than before. The sector is composed of high quality companies with stronger earnings growth expectations and more attractive valuations than its nearest peers – the US technology industry. We think this valuation gap versus the US can close. We believe EM technology will continue to compound its high returns and growth and achieve the valuation which is reflective of its global leadership. This global recognition of EM technology’s leadership and the companies’ delivery of earnings growth is what can turn the tide for EM as a whole, helping to navigate towards an exciting future.
Sources
1Source: FactSet, as of 30 June 2024.
2FactSet, July 2024.
Important Information
This information is issued and approved by Martin Currie Investment Management Limited (‘MCIM’), authorised and regulated by the Financial Conduct Authority. It does not constitute investment advice. Market and currency movements may cause the capital value of shares, and the income from them, to fall as well as rise and you may get back less than you invested.
The information contained in this document has been compiled with considerable care to ensure its accuracy. However, no representation or warranty, express or implied, is made to its accuracy or completeness. Martin Currie has procured any research or analysis contained in this document for its own use. It is provided to you only incidentally and any opinions expressed are subject to change without notice.
This document may not be distributed to third parties. It is confidential and intended only for the recipient. The recipient may not photocopy, transmit or otherwise share this [document], or any part of it, with any other person without the express written permission of Martin Currie Investment Management Limited.
This document is intended only for a wholesale, institutional or otherwise professional audience. Martin Currie Investment Management Limited does not intend for this document to be
issued to any other audience and it should not be made available to any person who does not meet this criteria. Martin Currie accepts no responsibility for dissemination of this document to a person who does not fit this criteria.
The document does not form the basis of, nor should it be relied upon in connection with, any subsequent contract or agreement. It does not constitute, and may not be used for the purpose of, an offer or invitation to subscribe for or otherwise acquire shares in any of the products mentioned.
Past performance is not a guide to future returns.
The distribution of specific products is restricted in certain jurisdictions, investors should be aware of these restrictions before requesting further specific information.
The views expressed are opinions of the portfolio managers as of the date of this document and are subject to change based on market and other conditions and may differ from other portfolio managers or of the firm as a whole. These opinions are not intended to be a forecast of future events, research, a guarantee
of future results or investment advice. There can be no assurance that any prediction, projection or forecast on the economy, stock market, bond market or the economic trends of the markets will be realised.
Some of the information provided in this document has been compiled using data from a representative account. This account has been chosen on the basis it is an existing account managed by Martin Currie, within the strategy referred to in this document.
Representative accounts for each strategy have been chosen on the basis that they are the longest running account for the strategy. This data has been provided as an illustration only, the figures should not be relied upon as an indication of future
performance. The data provided for this account may be different to other accounts following the same strategy. The information should not be considered as comprehensive and additional information and disclosure should be sought.
The information provided should not be considered a recommendation to purchase or sell any particular strategy/ fund/security. It should not be assumed that any of the securities discussed here were or will prove to be profitable.
It is not known whether the stocks mentioned will feature in any future portfolios managed by Martin Currie. Any stock examples will represent a small part of a portfolio and are used purely to demonstrate our investment style. Holdings are subject to change.
Risk warnings – Investors should also be aware of the following risk factors which may be applicable to the strategy shown in this document.
All investments involve risk including the potential for loss.
- Investing in foreign markets introduces a risk where adverse movements in currency exchange rates could result in a decrease in the value of your investment.
- This strategy may hold a limited number of investments. If one of these investments falls in value this can have a greater impact on the strategy’s value than if it held a larger number of investments.
- Smaller companies may be riskier and their shares may be less liquid than larger companies, meaning that their share price may be more volatile.
- Emerging markets or less developed countries may face more political, economic or structural challenges than developed countries. Accordingly, investment in emerging markets is generally characterised by higher levels of risk than investment in fully developed markets.
- The strategy may invest in derivatives Index futures and FX forwards to obtain, increase or reduce exposure to underlying assets. The use of derivatives may result in greater fluctuations of returns due to the value of the derivative not moving in line with the underlying asset. Certain types of derivatives can be difficult to purchase or sell in certain market conditions.
For wholesale investors in Australia:
This material is provided on the basis that you are a wholesale client. MCIM has entered an Intermediary arrangement with Franklin Templeton Australia Limited (ABN 76 004 835 849) (AFSL No. 240827) (FTAL) to facilitate the provision of financial services by MCIM to wholesale investors in Australia. Franklin Templeton Australia Limited is part of Franklin Resources, Inc., and holds an Australian Financial Services Licence (AFSL No. AFSL240827) issued pursuant to the Corporations Act 2001.
For professional investors in Canada.
This material is intended for residents in, or incorporated in, Canada and are a Permitted Client for the purposes of MI 31-103. The information on this section of the website is not intended for use by any other person, including members of the public.
Martin Currie Inc, incorporated in New York with its registered office at 280 Park Avenue, New York, NY 10017 and having a UK branch registered in Scotland (no SF000300), Head office, 5 Morrison Street, 2nd floor, Edinburgh, EH3 8BH, Tel: +44 (0) 131 229 5252 Fax: +44 (0) 131 222 2532 www.martincurrie.com, operates under the International Adviser Exemption with the Ontario Securities Commission (‘OSC’) and is therefore currently not required to be registered as a portfolio manager for the purposes of MI 31-103. Martin Currie Inc. is also authorised by the UK Financial Conduct Authority.
For the avoidance of doubt, nothing excludes, limits or restricts our obligations to you under the UK Financial Services and Market Act 2000, National Instruments or any other applicable law or regulation.
The opinions and views in this website do not take into account your individual circumstances, objectives, or needs and are not intended to be recommendations of particular financial instruments or strategies to you.
This website does not identify all the risks (direct or indirect) or other considerations which might be material to you when entering any financial transaction. You should consult with your professional advisers before undertaking any investment activity. The information provided on this website should not be treated as advice or a recommendation to buy or sell any particular security or other investment. The information on this website has not been reviewed by any competent regulatory authority.
For professional investors:
In the People’s Republic of China:
This document does not constitute a public offer of the strategy, whether by sale or subscription, in the People’s Republic of China (the “PRC”). These strategies are not being offered or sold directly or indirectly in the PRC to or for the benefit of, legal or natural persons of the PRC.
Further, no legal or natural persons of the PRC may directly or indirectly purchase any of the strategy or any beneficial interest therein without obtaining all prior PRC’s governmental approvals that are required, whether statutorily or otherwise. Persons who come into possession of this document are required by the issuer and its representatives to observe these restrictions.
In Hong Kong:
The contents of this document have not been reviewed by any regulatory authority in Hong Kong. You are advised to exercise caution in relation to the offer. If you are in any doubt about any of the contents of this document, you should obtain independent professional advice.
In South Korea:
This document is for information purposes only. It is prepared and presented to provide an introduction to the business of MCIM and its related companies (collectively known as ‘Martin Currie’). This document does not constitute an offer to sell or a solicitation of any offer to invest in any security, fund or other vehicle managed or advised by Martin Currie.
None of the security(ies), fund(s) or vehicle(s) managed by or advised by Martin Currie are registered in South Korea under the Financial Investment Services and Capital Markets Act of Korea and accordingly, none of these instruments nor any interest therein may be offered, sold or delivered, or offered or sold to any person for re-offering or resale, directly or indirectly, in South Korea or to any resident of South Korea except pursuant to applicable laws and regulations of South Korea.
Martin Currie is not registered with or regulated by any regulatory authorities in South Korea.
Copyright © 2024 Franklin Templeton. All rights reserved. Investment Products: NOT FDIC INSURED | NO BANK GUARANTEE | MAY LOSE VALUE