Content navigation
Taking stock of 2024
2024 was a year of positive equity momentum globally. While US markets dominated, EM offered meaningful returns which outperformed most developed international markets.
Investors remain focused on policy proposals from the US, rising bond yields, and the Chinese economy. But we continue to see long-term opportunities in the emerging markets asset class.
China remains a debate point due to performance in recent years, but 2024 has seen the market begin to reflect fundamentals again.
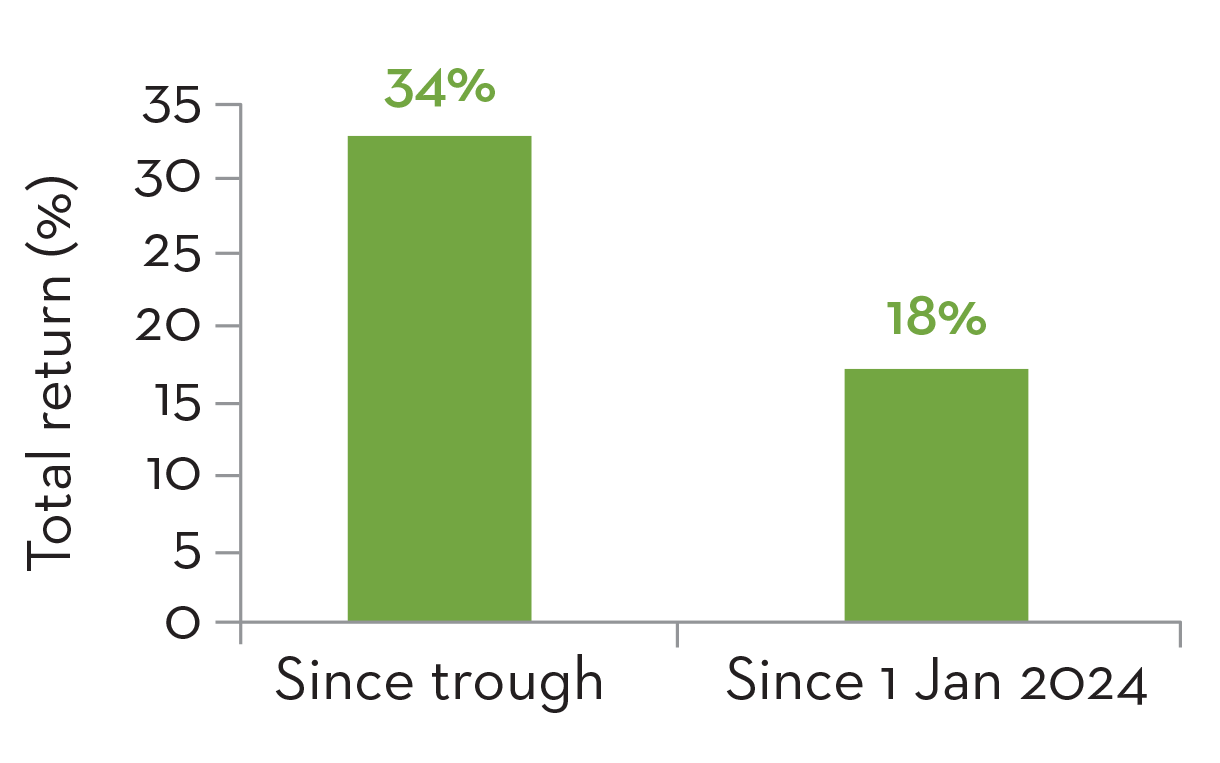
MSCI China has returned +18% YTD1
EM Earnings vs Developed Markets
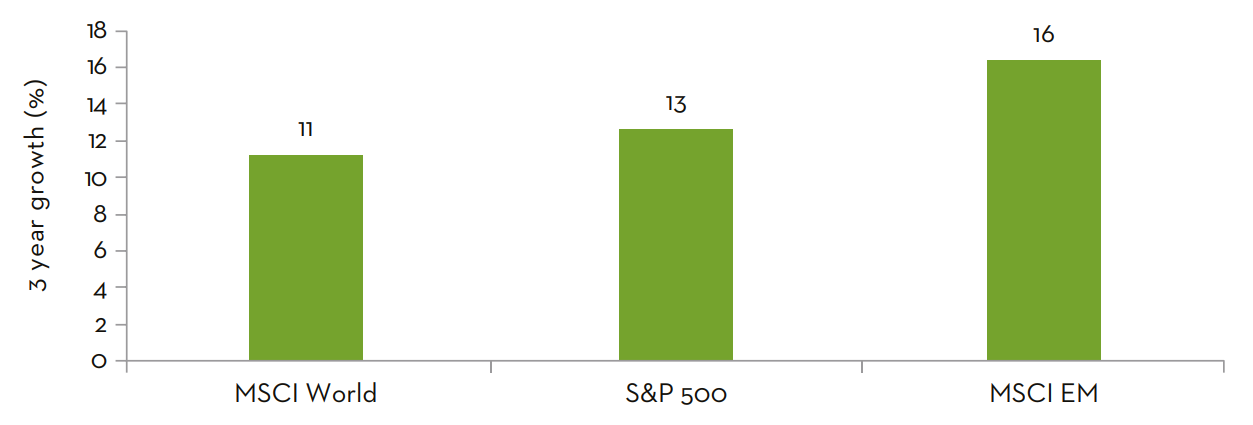
Source: FactSet as at 4 October 2024. Earnings per Share (EPS) Growth measured using the Compound Annual Growth Rate (CAGR) from 1 January 2024 to 31 December 2026.
We are excited about what 2025 will bring where consensus earnings growth estimates in EM are best-in-class and yet global allocations to EM remain at 10-year lows2.
Optimism interrupted by near-term volatility
Performance under the 2016-2020 Trump administration
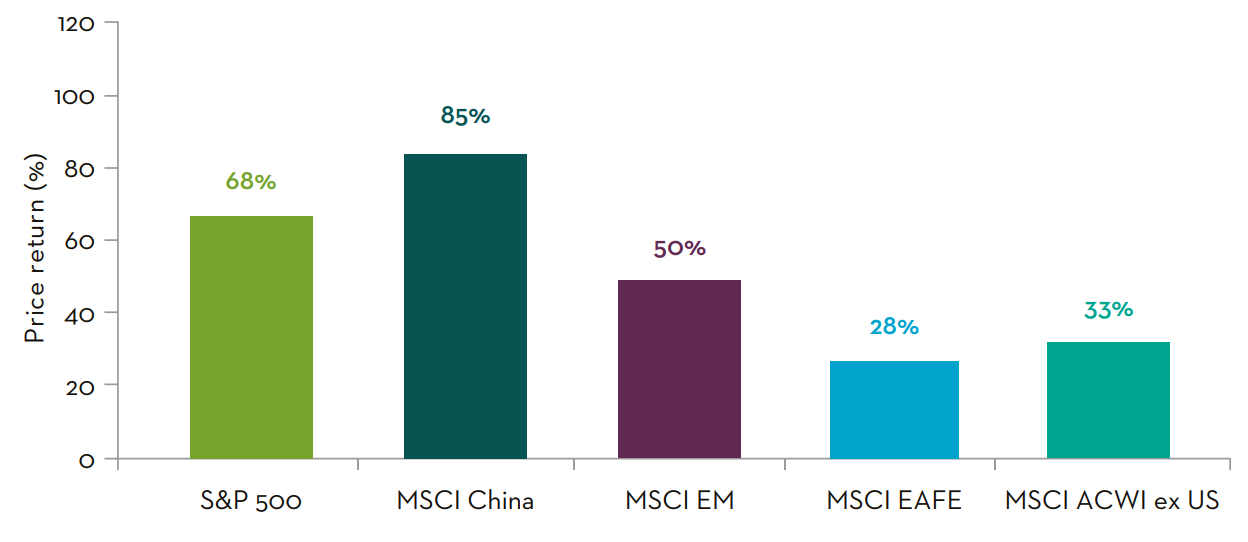
Source: Franklin Templeton and Morningstar as at 2 October 2024 in USD. Market returns for different presidential terms are over the following period: Donald Trump 1 January 2017 – 31 December 2020.
Performance one week following the US election is strikingly similar to 2016, when international equities lagged and US equities rallied. In 2016, investors expected import tariffs, US tax cuts, and other policies to favour domestic-oriented companies.
Yet in his first term, many trends reversed: bond yields fell, the US dollar weakened, domestic large caps outperformed. Importantly, China outperformed the US.
Contents
1. We are excited for 2025 and beyond
2. EM integral to AI innovation
3. A return to fundamentals to India
4. Policy should continue to support Chinese equities in 2025
5. Long-term investment outlook for EM is positive
1. We are excited for 2025 and beyond
Strong economic growth, improving inflationary environment and easing interest rates should be supportive of EM equities in 2025. We think markets will refocus on company fundamentals and that the key building blocks for growth are those operating in the following areas.

Information Technology
EM companies are at the heart of Artificial Intelligence (AI) innovation
23%

India
Return to fundamentals
20%

China
Policy support and valuation opportunities
27%
Source: FactSet, as of 27 November 2024. Weight of sector/country within MSCI Emerging Markets shown.
2. EM integral to AI innovation
IT stocks positioned to maintain market leadership in EM
EM tech has world-leading Intellectual Property (IP) and continues to harness long-term structural growth opportunities.
EM IT offers strong fundamentals
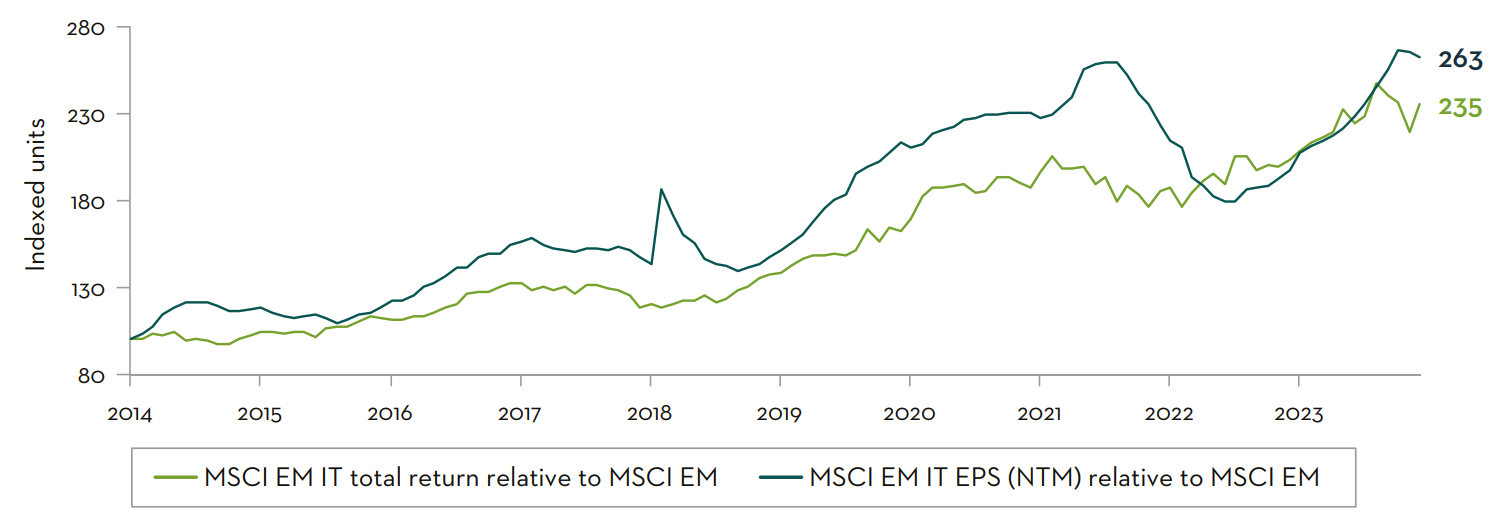
Source: FactSet. Earnings per Share (EPS) using Next Twelve Months (NTM) Earnings. Past 10 years: 28 November 2014 to 31 October 2024.
Despite the continued delivery, positive outlook and competitive moats, it remains at a significant discount to US technology.3
| MSCI Index | P/E (NTM) | 3-year EPS Growth (%) |
|---|---|---|
| EM Technology | 115x | 37% |
| US Technology | 28x | 19% |
EM has depth and breadth of exposure to the AI value chain
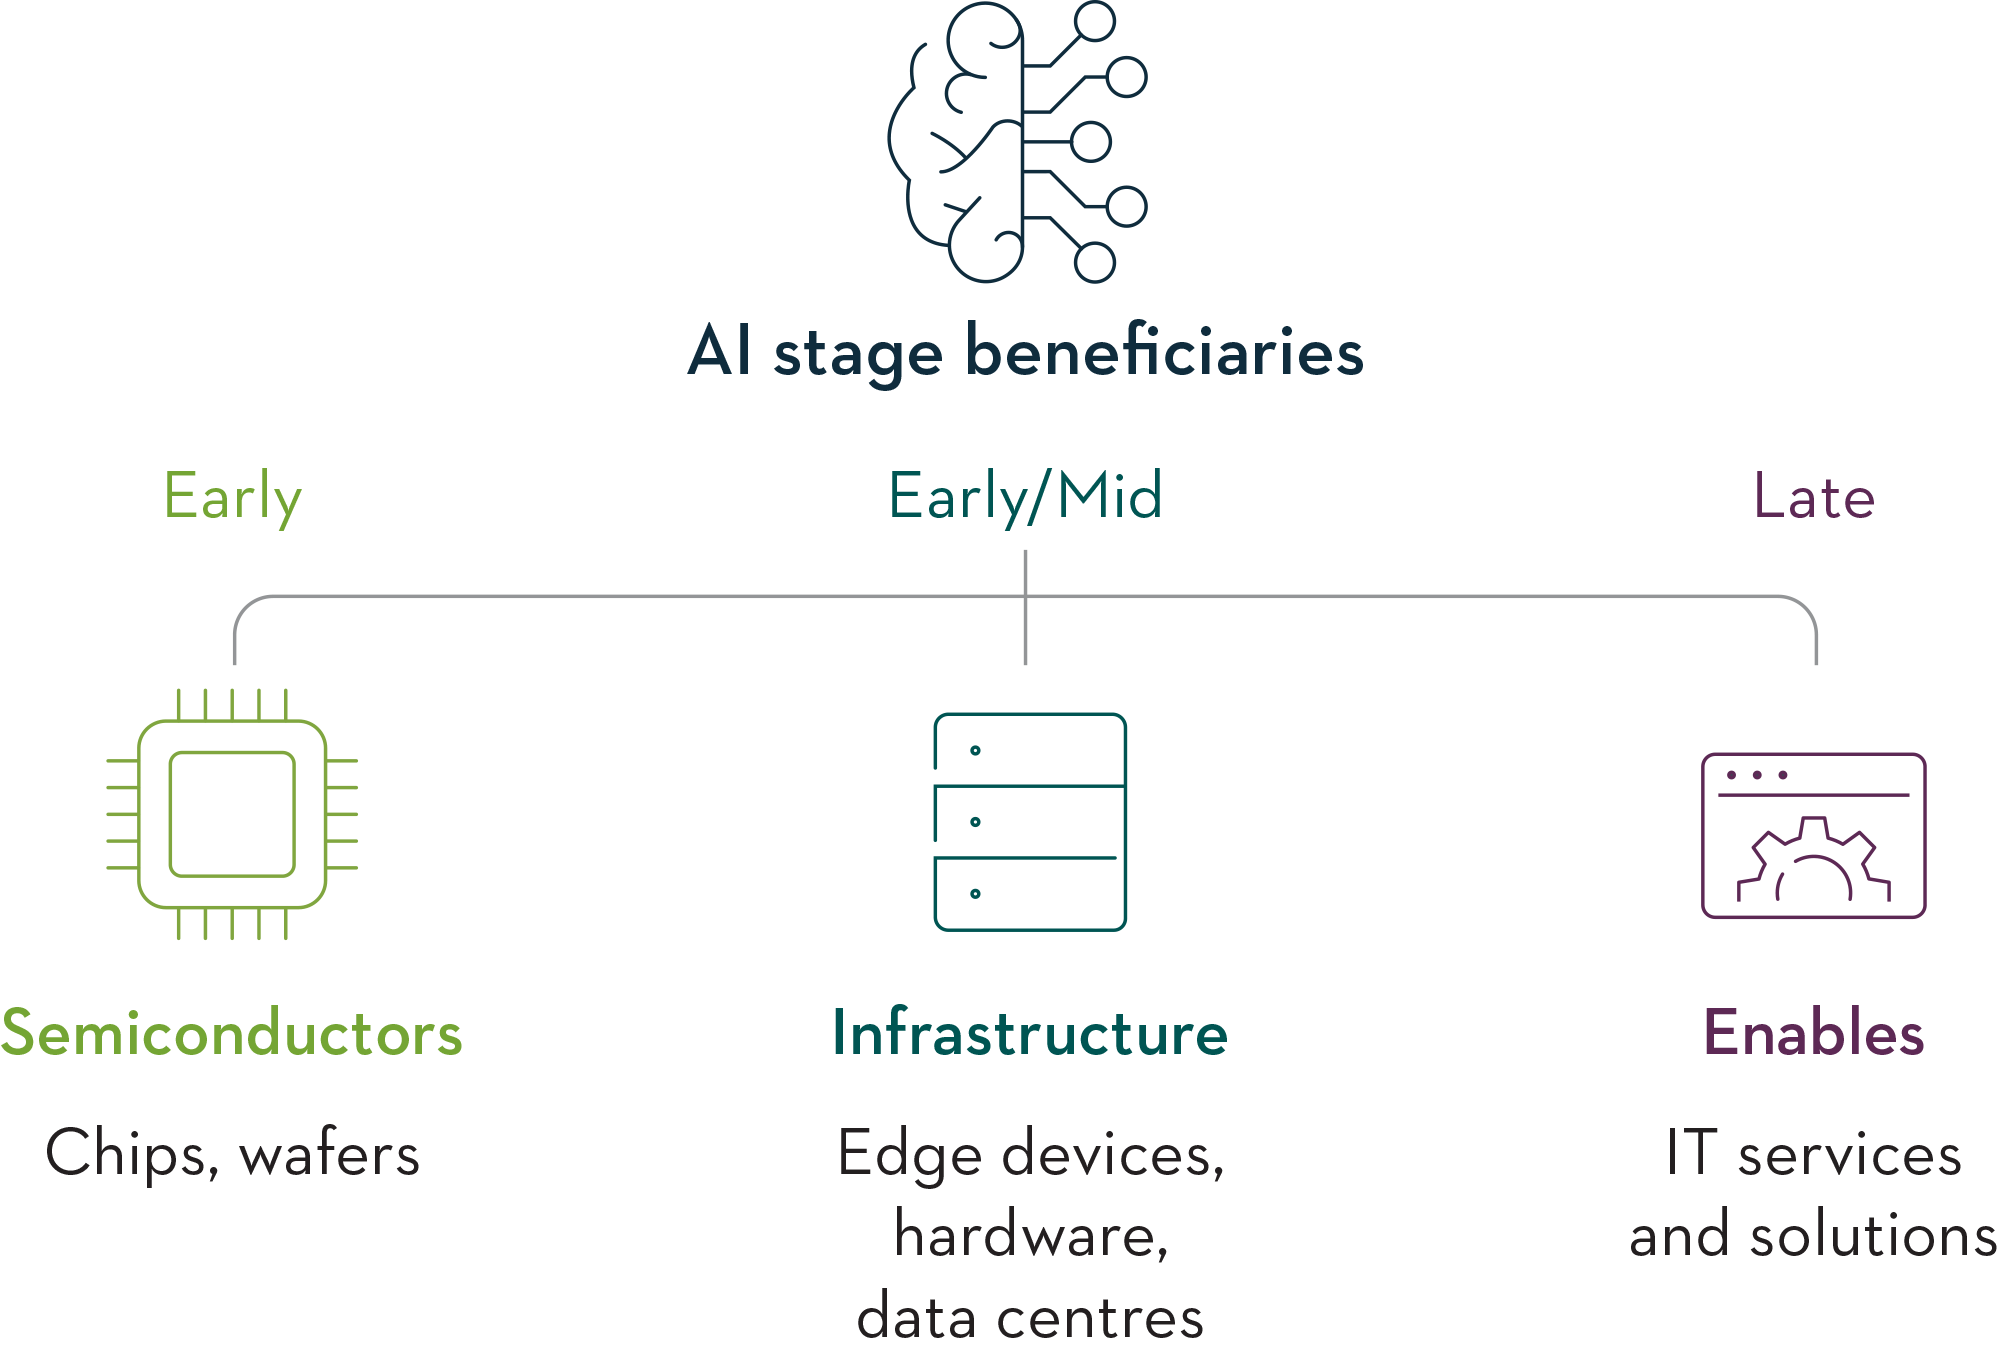
The life cycle of AI adaption creates opportunities over varying time horizons: early, mid and later stages of AI development. Geographic diversification remains crucial across EM to capture the range of opportunity.
-
EM tech has world-leading Intellectual Property (IP) and continues to harness long-term structural growth opportunities.
3. A return to fundamentals in India
We think India has the potential to drive returns in EM over the next decade as structural growth opportunities come to fruition and companies rise to the challenges presented to them.
Our positive views on the country, and the high quality and high growth companies we find there, is reflected in our portfolio overweight to India.
Foreign investment due to catch up with domestic
Domestic investor flows are strongly positive while foreign flows are flat. This short-term trend has a distorting market impact, supporting industrials, infrastructure and power companies, especially mid-caps.


Foreign flows
+US$0.1bn

Domestic flows
+US$54bn
The market is due a correction and this creates opportunity as foreign flows close the gap.
Source: CLSA Research, India Strategy: Flowmeter, October 2024. Year-to-date flows from 1 January 2024 to 31 October 2024.
Quality large caps offer a valuation opportunity
Nifty P/E vs Nifty Midcap P/E since the start of the Domestic Fund Flow Factor
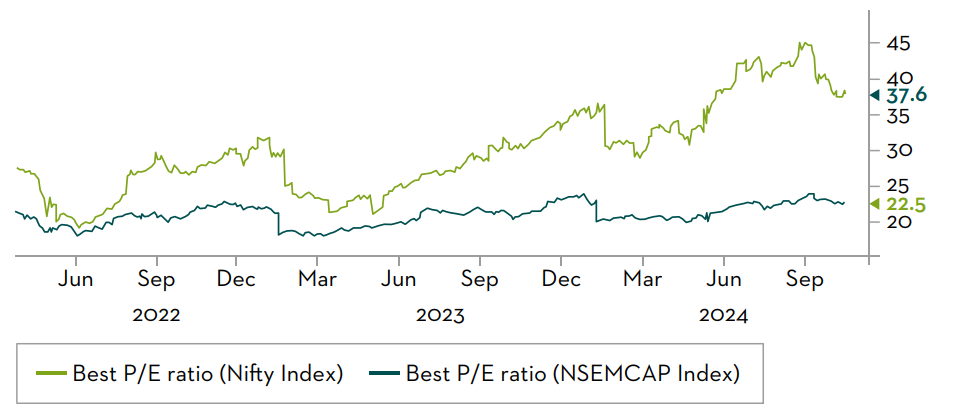
Source: Bloomberg as at 8 November 2024.
While mid-cap equities have been supported by domestic investment, this has pushed them to an outsized premium valuation compared to large caps and we believe that the market is due a correction in 2025.
We expect this retail phenomenon to be short-lived; high quality companies with sustainable growth are well placed to outperform in the long term.
Recent equity performance in India has been driven by domestic retail investors, pushing mid-cap names higher. Long-term compounding companies have not seen the same price appreciation despite delivering operationally.
We think the market is due an adjustment in 2025 and that company fundamentals will be recognised in share prices.
-
Despite these positive signs, Chinese equities remain undervalued relative to EM and developed markets.
4. Policy should continue to support Chinese equities in 2025
In 2024, Chinese equity market performance began to recover as market participants started to recognise company fundamentals once again.
While the past few years have seen equities driven largely by sentiment, Chinese companies have been delivering operationally with strong earnings growth. Despite the rally in 2024, we believe there is a long runway for further growth and we look forward to seeing this materialise in 2025.
China will be a key determinant of EM asset class performance in 2025
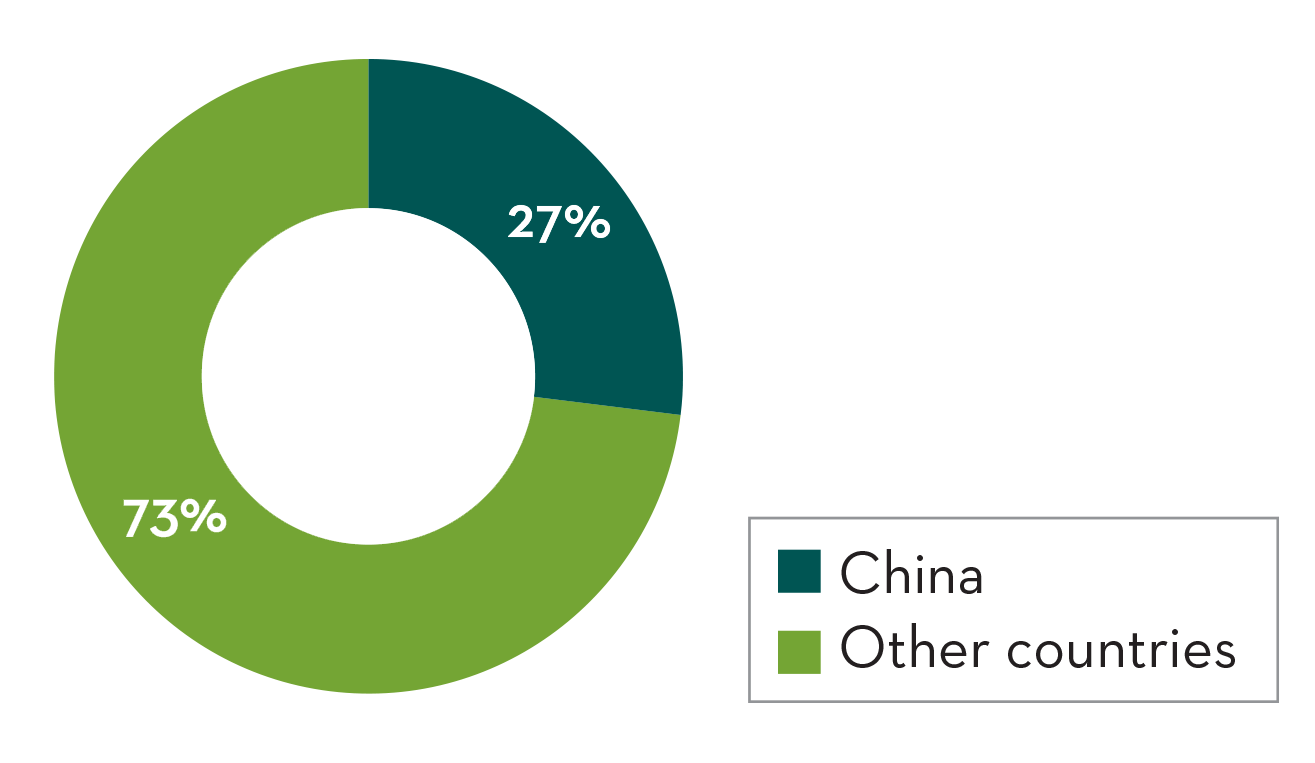
China remains a dominant part of the EM asset class, representing more than a quarter of the MSCI index.
Source: FactSet, as at 27 November 2024.
China’s recovery has already begun in 2024, driven by:
- Market recognising company fundamentals and their operational delivery
- Positive sentiment around the coordinated stimulus announced in Q3 2024
Source: FactSet, as at 27 November 2024. Trough date 22 January 2024.
Despite these positive signs, Chinese equities remain undervalued relative to EM and developed markets.
Discount to own 5-year history 12%4
Greater discount to 5-year average EM discount >12x4
Country active weight exposure for EM funds
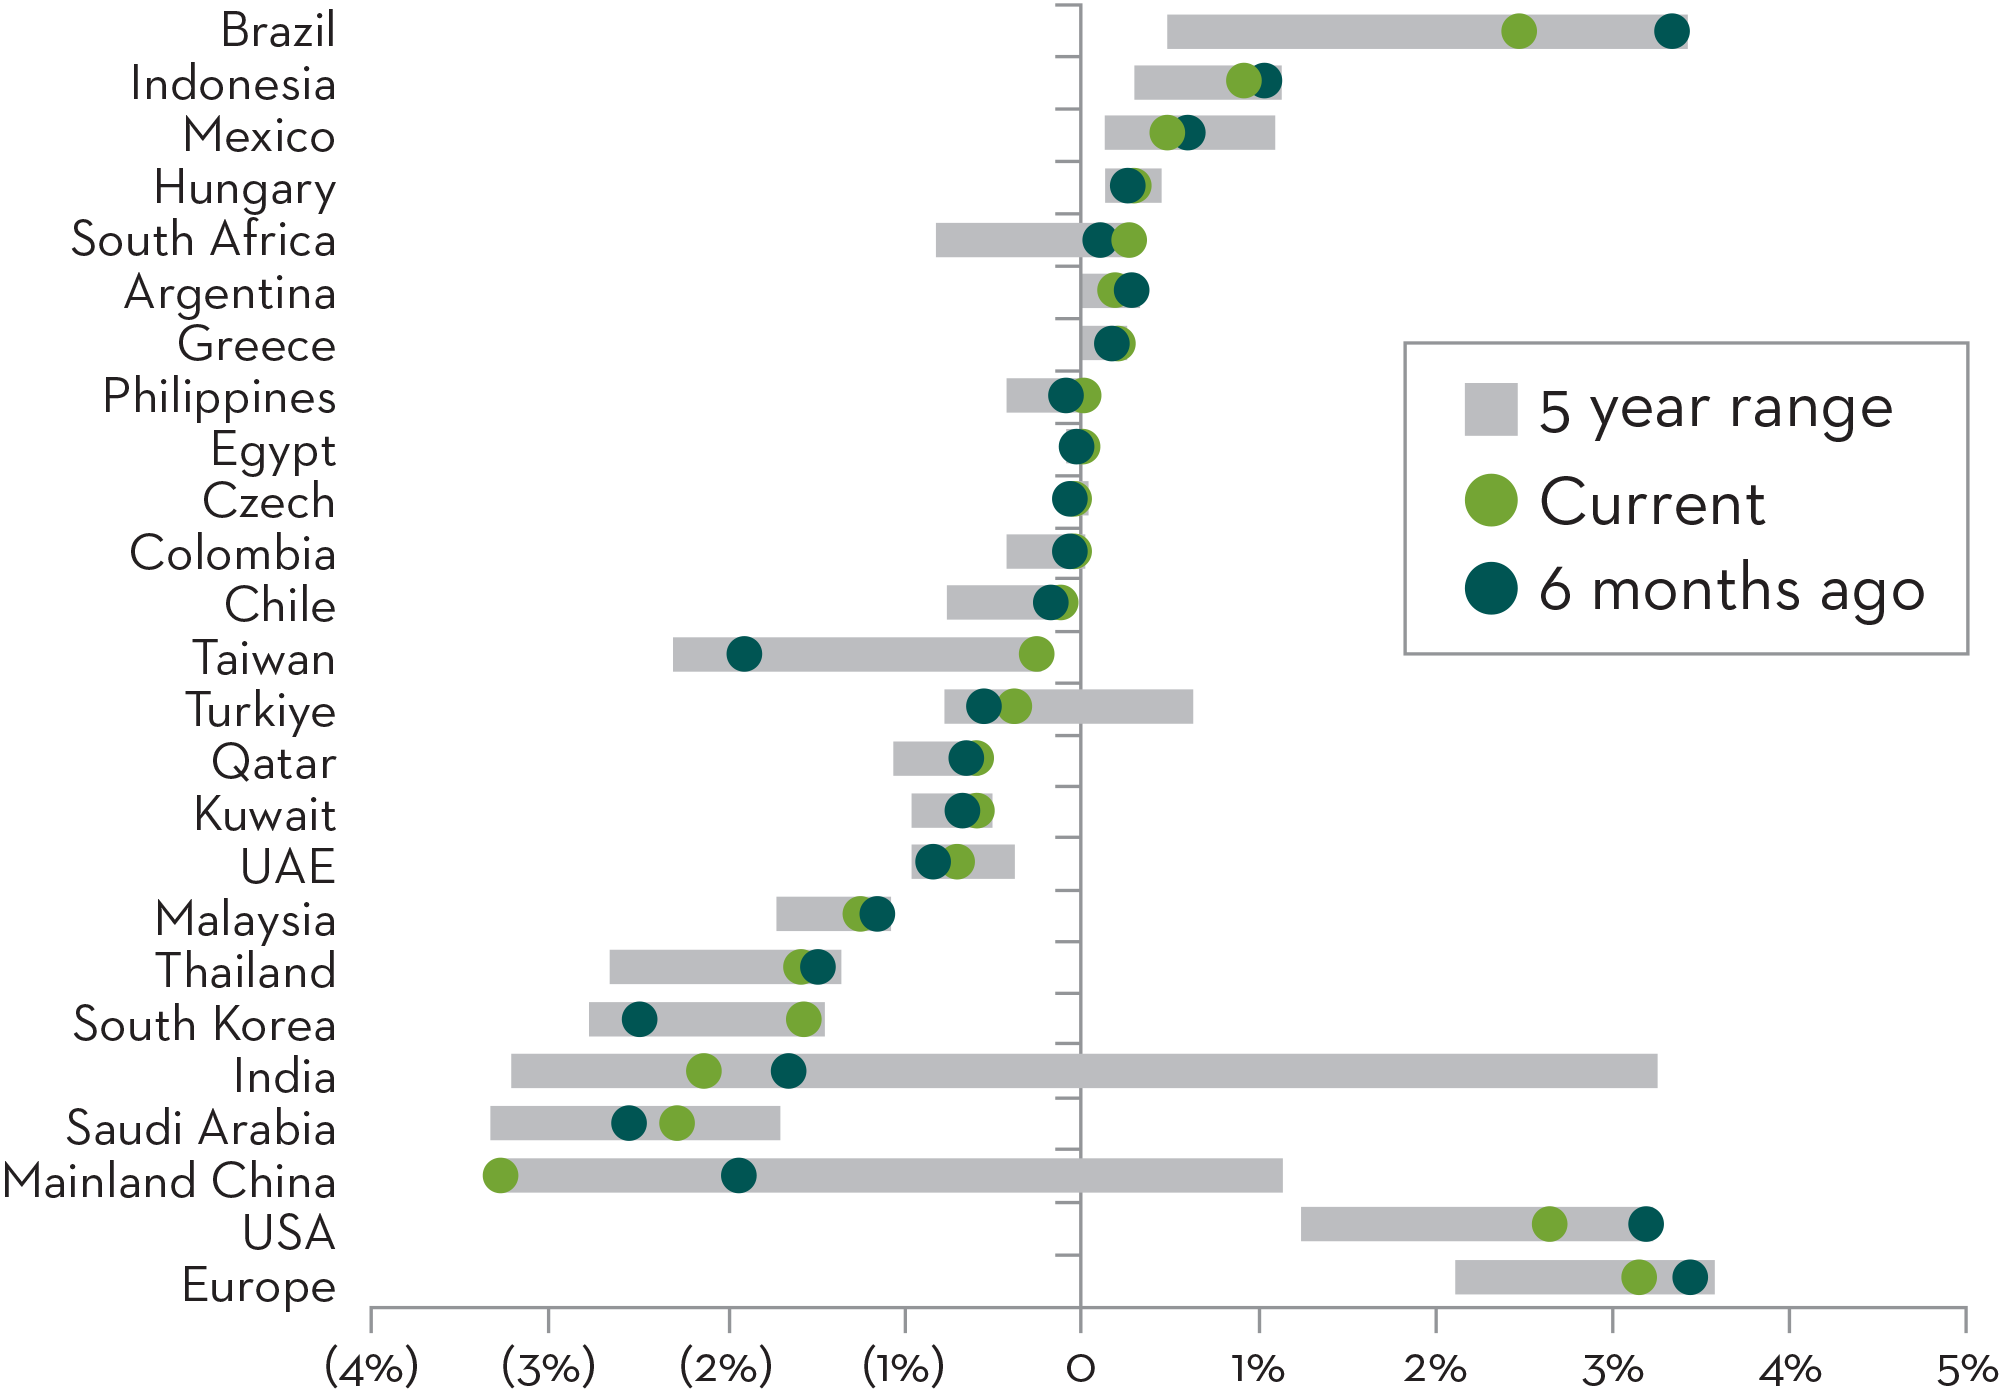
Source: HSBC, GEMs stock positioning: Mainland China rally is still the pain trade, 15 October 2024, page 5.
And investors remain significantly underweight China in their EM asset allocation. This has created an attractive opportunity as market participants close the gap and reward company delivery in 2025.
While there are headline risks to the Chinese economy relating to proposed tariffs from the US under its new administration, this risk equates to just 0.5% of listed Chinese company earnings.5 The Chinese market is dominated by the digital economy (40% of MSCI China)6 and other largely domestic-focused businesses.
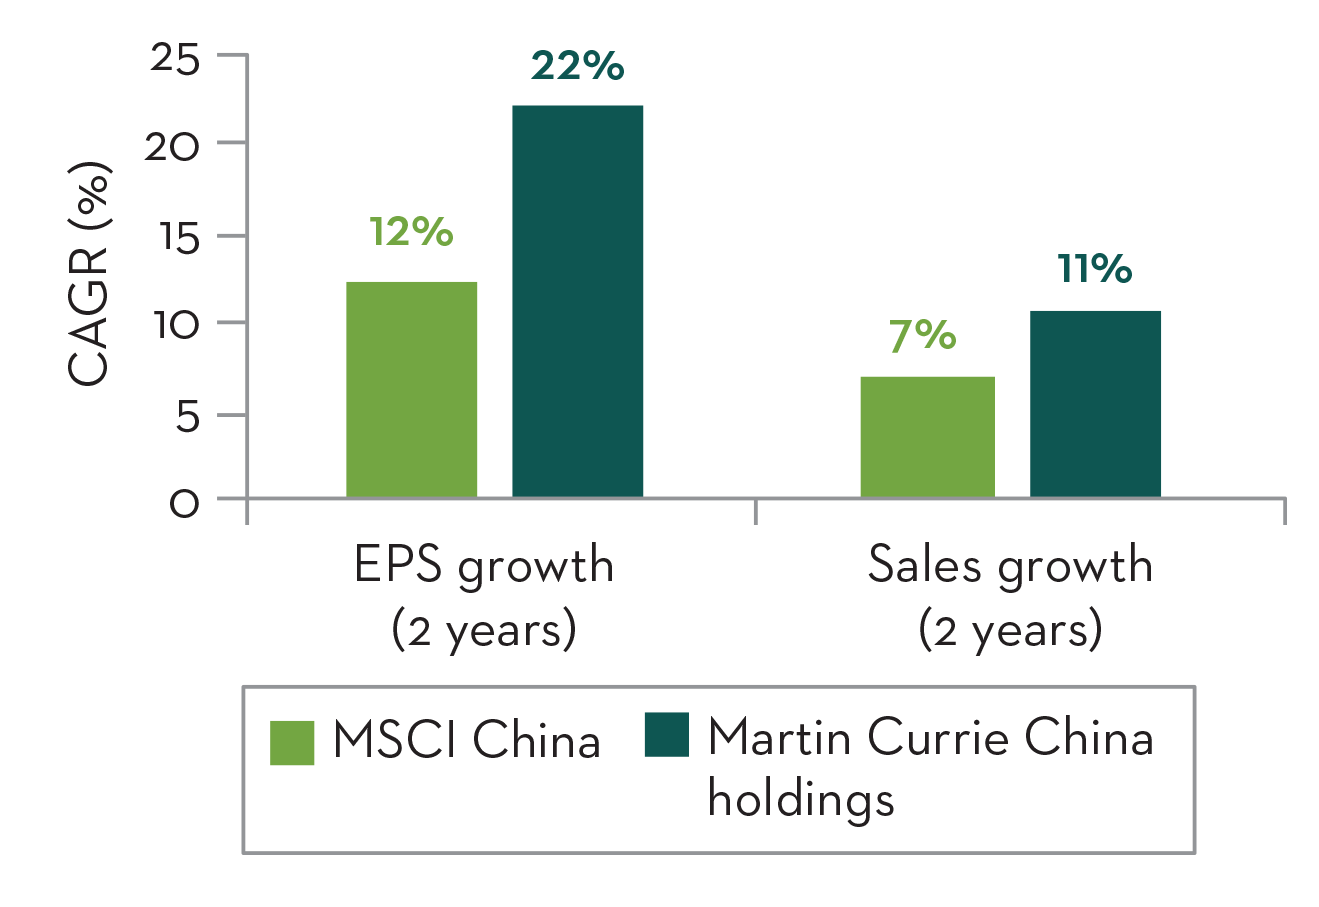
China is expected to deliver strong earnings and sales growth7; we have focused on Chinese names with a more domestic orientation, and we continue to track the potential US revenue exposure for our holdings.
-
This should be a big positive for consumption, the question then remains one of confidence. Will this simply result in an elevated savings rate, or will they go out a spend?
5. Long-term investment outlook for EM is positive
Despite significant variation in individual performance, share prices have responded logically to considerable changes in investment conditions, both nationally and sectorally. Consequently, our portfolio positioning has largely remained stable.
We firmly believe that the long-term investment outlook for emerging markets remains robust, and maintain strong confidence in our portfolio holdings.

The market persistently undervalues high-quality, sustainable growth companies

We are excited by the powerful synergy of technology adoption, urbanisation, and services sector growth prevalent in EM

In the current market, strong sustainability characteristics are vital to obtaining long-term value creation
Sources
1Source: FactSet as at 26 November 2024.
2Source: EFPR Global, JPMorgan, EM Money Trail, 11 October 2024.
3Source: FactSet as of 27 November 2024. Price-to-Earnings (P/E) using NTM Earnings and the EPS Growth measured using the Compound Annual Growth Rate (CAGR) from 1 January 2024 to 31 December 2026 for the MSCI Emerging Market Technology Index, MSCI USA Technology Index and S&P 500 Technology Index.
4Source: FactSet, as at 27 November 2024. Valuation measured using Next Twelve Months (NTM) Price-to-Earnings from 1 November 2019 to 31 October 2024 for MSCI China and MSCI Emerging Markets.
5Source: UBS Research, Global Economics & Market Outlook 2025-2026, page 50 © 2024 UBS. All rights reserved. Reproduced with permission. May not be forwarded or otherwise distributed.
6Source: Bloomberg, 29 April 2024.
7Source: FactSet, as at 25 November 2024. Earnings per Share (EPS) and Sales Growth measured using the Compound Annual Growth Rate (CAGR) from 1 January 2024 to 31 December 2025.
Important information
This information is issued and approved by Martin Currie Investment Management Limited (‘MCIM’), authorised and regulated by the Financial Conduct Authority. It does not constitute investment advice. Market and currency movements may cause the capital value of shares, and the income from them, to fall as well as rise and you may get back less than you invested.
The information contained in this document has been compiled with considerable care to ensure its accuracy. However, no representation or warranty, express or implied, is made to its accuracy or completeness. Martin Currie has procured any research or analysis contained in this document for its own use. It is provided to you only incidentally and any opinions expressed are subject to change without notice.
This document may not be distributed to third parties. It is confidential and intended only for the recipient. The recipient may not photocopy, transmit or otherwise share this [document], or any part of it, with any other person without the express written permission of Martin Currie Investment Management Limited.
This document is intended only for a wholesale, institutional or otherwise professional audience. Martin Currie Investment Management Limited does not intend for this document to be
issued to any other audience and it should not be made available to any person who does not meet this criteria. Martin Currie accepts no responsibility for dissemination of this document to a person who does not fit this criteria.
The document does not form the basis of, nor should it be relied upon in connection with, any subsequent contract or agreement. It does not constitute, and may not be used for the purpose of, an offer or invitation to subscribe for or otherwise acquire shares in any of the products mentioned.
Past performance is not a guide to future returns.
The distribution of specific products is restricted in certain jurisdictions, investors should be aware of these restrictions before requesting further specific information.
The views expressed are opinions of the portfolio managers as of the date of this document and are subject to change based on market and other conditions and may differ from other portfolio managers or of the firm as a whole. These opinions are not intended to be a forecast of future events, research, a guarantee of future results or investment advice.
Please note the information within this report has been produced internally using unaudited data and has not been independently verified. Whilst every effort has been made to ensure its accuracy, no guarantee can be given.
Some of the information provided in this document has been compiled using data from a representative account. This account has been chosen on the basis it is an existing account managed by Martin Currie, within the strategy referred to in this document. Representative accounts for each strategy have been chosen on the basis that they are the longest running account for the strategy. This data has been provided as an illustration only, the figures should not be relied upon as an indication of future performance. The data provided for this account may be different to other accounts following the same strategy. The information should not be considered as comprehensive and additional information and disclosure should be sought.
The information provided should not be considered a recommendation to purchase or sell any particular strategy/ fund / security. It should not be assumed that any of the securities discussed here were or will prove to be profitable.
It is not known whether the stocks mentioned will feature in any future portfolios managed by Martin Currie. Any stock examples will represent a small part of a portfolio and are used purely to demonstrate our investment style.
Risk warnings – Investors should also be aware of the following risk factors which may be applicable to the strategy shown in this document.
- Investing in foreign markets introduces a risk where adverse movements in currency exchange rates could result in a decrease in the value of your investment.
- This strategy may hold a limited number of investments. If one of these investments falls in value this can have a greater impact on the strategy’s value than if it held a larger number of investments.
- Smaller companies may be riskier and their shares may be less liquid than larger companies, meaning that their share price may be more volatile.
- Emerging markets or less developed countries may face more political, economic or structural challenges than developed countries. Accordingly, investment in emerging markets is generally characterised by higher levels of risk than investment in fully developed markets.
- The strategy may invest in derivatives Index futures and FX forwards to obtain, increase or reduce exposure to underlying assets. The use of derivatives may result in greater fluctuations of returns due to the value of the derivative not moving in line with the underlying asset. Certain types of derivatives can be difficult to purchase or sell in certain market conditions.
