
Content navigation

It has been a mixed Q2 2024 reporting season, with weakening trends on sales surprises and growth, both in the US and Europe. Growth was losing momentum on sales, and to a lesser extent on earnings. Whilst margin pressure is not as apparent as in the previous reporting season for these geographies, there is still some underlying margin pressure in specific sectors. In our latest update, we provide the key highlights from this round of reporting.
The Magnificent Seven remained a strong contributor to the US reporting season, although growth momentum is weakening there too, mostly as a result of the tougher year-on-year (YoY) comparatives on both sales and earnings. Japan has continued to post a supportive results season, whilst emerging markets (EM) reporting season has been improving markedly versus previous quarters, with likely less currency headwinds and easing pressure on margins. In terms of sectors, generally, Energy, Materials, Consumer, Industrials sectors are on the weaker side, whilst Utilities, Financials and Technology have been showing strong and/or strengthening trends. Healthcare has also been posting some improving trends.
Earnings momentum has been improving during Q1 and Q2, which has led to upward revisions in consensus estimates, although we now note some loss of momentum as we enter into Q3, with a rollover in trends across geographies, and earnings revisions turning outright negative for UK and Asia. Whilst earnings growth expectations have been increasing, notably in the US and EM, we still see consensus estimates as being overly optimistic, in light of potentially weakening economic momentum in H2. Our top down forecasts remain below consensus across many key geographies, although our estimates are now in line with consensus at the global level.
| Q2 2024 | US (SPX) | Magnificent Seven | S&P ex Magnificent Seven | Europe (SXXP) | Eurozone (SXXE) | Japan (Topix) | EM (BBRG EM) | World (BBRG World) |
|---|---|---|---|---|---|---|---|---|
| % of companies that reported | 91% | 86% | 91% | 67% | 79% | 88% | 47% | 68% |
| % companies that beat on sales | 48% | 67% | 47% | 50% | 50% | 57% | 51% | 52% |
| Sales surprise | 1% | 1% | 1% | 2% | 2% | 3% | 4% | 2% |
| % companies that beat on earnings | 79% | 83% | 79% | 55% | 56% | 60% | 56% | 66% |
| Earnings Surprise | 4% | 5% | 4% | 5% | 4% | 10% | 3% | 4% |
| Sales growth YoY | 5% | 11% | 4% | 2% | 2% | 7% | 10% | 5% |
| Earnings growth YoY | 9% | 26% | 6% | 3% | 1% | 11% | 15% | 9% |
Source: Bloomberg as at 11 August 2024. SPX: S&P 500, SXXP: Stock Europe 600, SXXE: Euro Stoxx, BBRG EM: Bloomberg Emerging Markets, BBRG World: Bloomberg World.
-
Earnings momentum has been improving across geographies in the first half of 2024, turning positive for most geographies over that period, apart from Asia ex Japan.
| Region | Martin Currie earnings growth estimate (%YoY) | Consensus earnings growth estimate (%YoY) |
|---|---|---|
| US | +8 | +10 |
| Global | 6 | +6 |
| Europe | 3 | +4 |
| Asia ex Japan | 8 | +22 |
| Japan | 12 | +13 |
Source: Martin Currie and Bloomberg as at 11 August 2024.

US
Mixed reporting, sluggish sales surprises and less supportive growth, with a loss of momentum on both sales and earnings growth
In the US, 91% of companies have reported Q2 2024 results, showing a less supportive reporting season on sales, despite earnings still coming through. Profit warnings have been picking up, which could lead to risk on the earnings momentum front. Companies within the Magnificent Seven have remained an important positive contributor, although the growth momentum of that basket is also waning.
On sales, only 48% of companies beat estimates, which was markedly lower than the previous two reporting seasons (56% and 55% respectively for Q4 2023 and Q1 2024), with a similarly positive surprise of only c.+0.8% on average. Three sectors posted a negative sales surprise, which were Materials, Utilities and Consumer Staples. A further five sectors posted a less than 1% surprise, which were Financials, Technology, Real Estate, Industrials, and Communications. Most positive beats came from Energy (+3%), Consumer Discretionary (+1.5%) and Healthcare (+1.2%). Most negative surprises came from Materials (-3.6%), Utilities (-2.6%), and Consumer Staples (-0.5%).
On earnings, 79% of companies posted a positive surprise, with an average beat of +4.1%, which is markedly weaker than the prior reporting season at +8.2%. Most positive beats came from Utilities (+10.2%), Healthcare (+8.9%) and Financials (+8.4%). Only Communications posted a negative surprise on earnings at -9.8%.
Growth YoY came in at +5.0% on sales, and +9.3% on earnings. On sales the strongest growth YoY was posted by Energy (+7.8%), Technology (+7.2%) and Consumer Discretionary (+6.8%), whilst negative sales growth came from Materials (-1.4%), and Consumer Staples (-1.3%).
On earnings the strongest growth was posted by Consumer Discretionary (+18.9%), Healthcare (+17%), and Utilities (+15.2%). Negative earnings growth YoY was posted by Materials (-7%), Staples (-1%) and Industrials (-0.5%).
The Magnificent Seven is worth highlighting again, as it is an important contributor to the positive reporting season. With six out of the seven companies reporting, 67% beat on sales, 83% beat on earnings, with a positive surprise of 0.7% on sales and +5.4% on earnings. Growth achieved was +11% on sales and +26% on earnings - still significantly stronger than the broader US market index, but growth momentum is slowing down compared to previous reporting seasons, in part as a result of the tougher comparatives coming through.

Europe
Balanced beat/miss ratio both on sales and earnings, with growth remaining pedestrian in low-single-digit range
In Europe, 67% of companies have reported Q2 2024 results, with a beat on both sales and earnings.
On sales, 50.1% of companies surprised positively, with a positive beat of +1.8% on average. Most positive beats came from Financials, with a +12% positive surprise, followed by Utilities (+7.1% surprise), and Communications at +2.7%. Negative surprise came from Real Estate (-4.4%), Energy (-2.2%), Consumer Staples (-0.7%) and Materials (-0.6%).
On earnings, 55% of companies beat estimates, with an aggregate positive earnings surprise of +4.5%. Strongest positive surprise came from Utilities (+39%), Communications (+18%) and Financials (+8%). On the negative earnings surprise, Materials came in at -13.7%, followed by Energy (-1.6%), and Consumer Discretionary (-1.3%).
Growth achieved during the period was weaker on the top line, with sales growth on aggregate coming in at c.+1.8% YoY. Strongest growth came from Utilities (+14%), Financials (+7%), and Real Estate (+6%). Negative sales growth came from Technology (-5%), Materials (-5%), and Consumer Discretionary (-2%). On earnings, growth came in at +2.9% YoY, with strongest positive growth coming from Communications (+45%), Utilities (+39%), and Real Estate (+14%). Negative earnings growth was most pronounced in Materials (-25%), Technology (-20%) and Consumer Discretionary (-2%).
Source: Bloomberg as at 11 August 2024 unless otherwise stated.

Japan
Strong reporting season, with supportive but waning growth
In Japan, 88% of companies have reported, with a +10 positive earnings surprise and a sales surprise of +3%. Sales growth came in at +6.6%, with earnings growth at +10.8%, implying an ongoing positive margin trend, although nowhere near as positive as seen for the Q4 2023 reporting season. The beat/miss ratio was positive with 57% of companies beating on sales, and 60% on earnings.
Most positive earnings surprise came from Utilities (+52%), Financials (+23%), and Healthcare (+23%), whilst most negative surprise came from Communications (-24%), Consumer Staples (-3%) and Energy (-2%).
Strongest earnings growth was posted by Telecoms (+56%), Energy (+43%), and Financials (+30%). Negative earnings growth was reported by Utilities (-39%), and Healthcare (-3%).

Emerging Markets
More supportive reporting season, with improving trends both on surprise, margins and on growth
In EM, 47% of companies have reported, with a sales surprise of +4.2%, and an earnings surprise of +2.9%. Sales growth was +9.6% YoY, whilst earnings growth was +14.8%, showing improvement in both growth and margin trends, as currency headwinds and margins pressures seem to be abating. Beat/miss ratio has been improving, with 51% of companies beating on sales, and 56% beating on earnings.
Most positive earnings surprise came from Industrials (+17%), Healthcare (+17%) and Technology (+15%), whilst most negative earnings surprise came from Energy (-12%), and Communications (-4%).
Strongest earnings growth was posted by Technology (+130%), Industrials (+71%), and Utilities (+50%). Most negative earnings growth was reported by Energy (-21%) and Communications (-5%).
Source: Bloomberg as at 11 August 2024 unless otherwise stated.
Earnings momentum and the top-down view
Earnings momentum has been improving across geographies in the first half of 2024, turning positive for most geographies over that period, apart from Asia ex Japan.
However, more recently, the trends have been rolling over, with the UK and Asia (ex Japan) turning negative again, whilst Europe and the US are deteriorating, they are still marginally positive. There is in our view a risk of ongoing deterioration in earning momentum trends, with the growing risk of weakening economic momentum. See chart below for illustration.
Earnings momentum of given equity markets
Changes in estimates of following year earnings 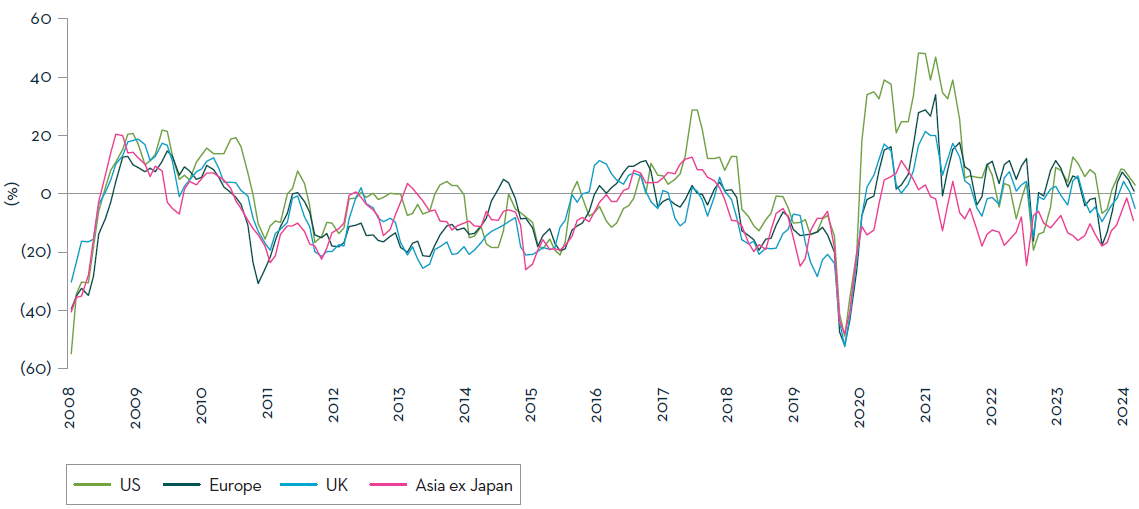
Source: FactSet and MSCI. Earnings momentum data and forecast EPS data as at 31 July 2024.
Our top down estimates are being revised up slightly, to +8% in the US (from +5% previously), maintained at +3% in Europe, increased to +8% for Asia (from +5% previously), and to +12% for Japan (+6% previously), bringing our top down corporate earnings growth forecast at the global level up to +6% (from +4% previously). Our forecasts compare to consensus estimates currently standing at +10% for North America, +4% for Europe, +22% for Asia, +12% for Japan, and +6% at the global level.
Overall, we still see downside risk in some of the geographies, but at the global equity and European equity level, we are now in line with consensus estimates. The reporting season has been mixed, and earnings revisions are rolling over and turning negative for some geographies, which could weigh on sentiment in the market. However, in our view the key macro determinants will remain inflation figures and interest rate expectations.
Source: Bloomberg as at 11 August 2024 unless otherwise stated.
Important Information
This information is issued and approved by Martin Currie Investment Management Limited (‘MCIM’), authorised and regulated by the Financial Conduct Authority. It does not constitute investment advice. Market and currency movements may cause the capital value of shares, and the income from them, to fall as well as rise and you may get back less than you invested.
The information contained in this document has been compiled with considerable care to ensure its accuracy. However, no representation or warranty, express or implied, is made to its accuracy or completeness. Martin Currie has procured any research or analysis contained in this document for its own use. It is provided to you only incidentally and any opinions expressed are subject to change without notice.
This document is intended only for a wholesale, institutional or otherwise professional audience. Martin Currie Investment Management Limited does not intend for this document to be issued to any other audience and it should not be made available to any person who does not meet this criteria. Martin Currie accepts no responsibility for dissemination of this document to a person who does not fit this criteria.
The document does not form the basis of, nor should it be relied upon in connection with, any subsequent contract or agreement. It does not constitute, and may not be used for the purpose of, an offer or invitation to subscribe for or otherwise acquire shares in any of the products mentioned.
Past performance is not a guide to future returns.
The distribution of specific products is restricted in certain jurisdictions, investors should be aware of these restrictions before requesting further specific information.
The views expressed are opinions of the portfolio managers as of the date of this document and are subject to change based on market and other conditions and may differ from other portfolio managers or of the firm as a whole. These opinions are not intended to be a forecast of future events, research, a guarantee of future results or investment advice.
Please note the information within this report has been produced internally using unaudited data and has not been independently verified. Whilst every effort has been made to ensure its accuracy, no guarantee can be given.
Some of the information provided in this document has been compiled using data from a representative account. This account has been chosen on the basis it is an existing account managed by Martin Currie, within the strategy referred to in this document.
Representative accounts for each strategy have been chosen on the basis that they are the longest running account for the strategy. This data has been provided as an illustration only, the figures should not be relied upon as an indication of future performance. The data provided for this account may be different to other accounts following the same strategy. The information should not be considered as comprehensive and additional information and disclosure should be sought.
The information provided should not be considered a recommendation to purchase or sell any particular strategy/fund/security. It should not be assumed that any of the securities discussed here were or will prove to be profitable.
It is not known whether the stocks mentioned will feature in any future portfolios managed by Martin Currie. Any stock examples will represent a small part of a portfolio and are used purely to demonstrate our investment style.
Risk warnings – Investors should also be aware of the following risk factors which may be applicable to the strategy shown in this document.
- Investing in foreign markets introduces a risk where adverse movements in currency exchange rates could result in a decrease in the value of your investment.
- This strategy may hold a limited number of investments. If one of these investments falls in value this can have a greater impact on the strategy’s value than if it held a larger number of investments.
- Smaller companies may be riskier and their shares may be less liquid than larger companies, meaning that their share price may be more volatile.
- Emerging markets or less developed countries may face more political, economic or structural challenges than developed countries. Accordingly, investment in emerging markets is generally characterised by higher levels of risk than investment in fully developed markets.
For wholesale investors in Australia:
This material is provided on the basis that you are a wholesale client. MCIM has entered an Intermediary arrangement with Franklin Templeton Australia Limited (ABN 76 004 835 849) (AFSL No. 240827) (FTAL) to facilitate the provision of financial services by MCIM to wholesale investors in Australia. Franklin Templeton Australia Limited is part of Franklin Resources, Inc., and holds an Australian Financial Services Licence (AFSL No. AFSL240827) issued pursuant to the Corporations Act 2001.
For professional investors in Canada.
This material is intended for residents in, or incorporated in, Canada and are a Permitted Client for the purposes of NI 31-103. The information on this section of the website is not intended for use by any other person, including members of the public.
Martin Currie Inc, incorporated in New York with its registered office at 280 Park Avenue, New York, NY 10017 and having a UK branch registered in Scotland (no SF000300), Head office, 5 Morrison Street, 2nd floor, Edinburgh, EH3 8BH, Tel: +44 (0) 131 229 5252 Fax: +44 (0) 131 222 2532 www.martincurrie.com , operates under the International Adviser Exemption with the Ontario Securities Commission (‘OSC’) and is therefore currently not required to be registered as a portfolio manager for the purposes of MI 31-103. Martin Currie Inc. is also authorised by the UK Financial Conduct Authority.
For the avoidance of doubt, nothing excludes, limits or restricts our obligations to you under the UK Financial Services and Market Act 2000, National Instruments or any other applicable law or regulation.
he opinions and views in this website do not take into account your individual circumstances, objectives, or needs and are not intended to be recommendations of particular financial instruments or strategies to you. This website does not identify all the risks (direct or indirect) or other considerations which might be material to you when entering any financial transaction.
You should consult with your professional advisers before undertaking any investment activity. The information provided on this website should not be treated as advice or a recommendation to buy or sell any particular security or other investment. The information on this website has not been reviewed by any competent regulatory authority.
For professional investors:
In the People’s Republic of China:
This document does not constitute a public offer of the strategy, whether by sale or subscription, in the People’s Republic of China (the “PRC”). These strategies are not being offered or sold directly or indirectly in the PRC to or for the benefit of, legal or natural persons of the PRC.
Further, no legal or natural persons of the PRC may directly or indirectly purchase any of the strategy or any beneficial interest therein without obtaining all prior PRC’s governmental approvals that are required, whether statutorily or otherwise. Persons who come into possession of this document are required by the issuer and its representatives to observe these restrictions.
In Hong Kong:
The contents of this document have not been reviewed by any regulatory authority in Hong Kong. You are advised to exercise caution in relation to the offer. If you are in any doubt about any of the contents of this document, you should obtain independent professional advice.
In South Korea:
This document is for information purposes only. It is prepared and presented to provide an introduction to the business of MCIM and its related companies (collectively known as ‘Martin Currie’). This document does not constitute an offer to sell or a solicitation of any offer to invest in any security, fund or other vehicle managed or advised by Martin Currie.
None of the security(ies), fund(s) or vehicle(s) managed by or advised by Martin Currie are registered in South Korea under the Financial Investment Services and Capital Markets Act of Korea and accordingly, none of these instruments nor any interest therein may be offered, sold or delivered, or offered or sold to any person for re-offering or resale, directly or indirectly, in South Korea or to any resident of South Korea except pursuant to applicable laws and regulations of South Korea.
Martin Currie is not registered with or regulated by any regulatory authorities in South Korea.
Copyright © 2024 Franklin Templeton. All rights reserved. Investment Products: NOT FDIC INSURED | NO BANK GUARANTEE | MAY LOSE VALUE