
Content navigation
Over the last few years, investors have significantly decreased their exposure to Chinese equities as both growth and sentiment have been impacted by the slowing property market.
From a macroeconomic perspective, it is estimated that nearly c.30% of Gross Domestic Product (GDP) in China is linked to property either directly or indirectly. Historically speaking, real estate’s contribution to GDP has stayed relatively stable over the last ten years, with a direct contribution of c.8-10% and an indirect contribution of c19-22%1.
With the recent weakness in the property market apparent, we highlight the difference between the stock market and the economy, as well as our thoughts on the Chinese internet space:
- The Chinese stock market is under-indexed to property and property related names. State-owned enterprises (SOE) and heavy industry have decreased over time while new economy names have grown to be more important within the MSCI China Index. We are now seeing a move from traditional 'bricks and mortar' to an increased weighting in newer consumer and IT sectors; a switch from bricks to clicks.
- Chinese internet names are not only important from a benchmark perspective but can also offer a good balance of profit growth with an increasing focus on shareholder returns.
-
Chinese internet stocks now account for nearly 40% of MSCI China and nearly 11% of MSCI Emerging Markets.
Evolution of the Chinese stock market
The composition of MSCI China has undergone a dramatic transformation over time. In 2008, the top three sectors were financials, communication services (largely telecoms), and energy. While by the end of 2023, the top three sectors were consumer, communication services (Tencent is nearly 40% of this sector), and financials2.
Besides the obvious de-weighting of old economy sectors such as energy, materials, and financials, we see the growing importance of consumer names within the Chinese equity market. Today, consumer stocks account for over 30% of MSCI China.
Changing sectors
MSCI China Sector Weights
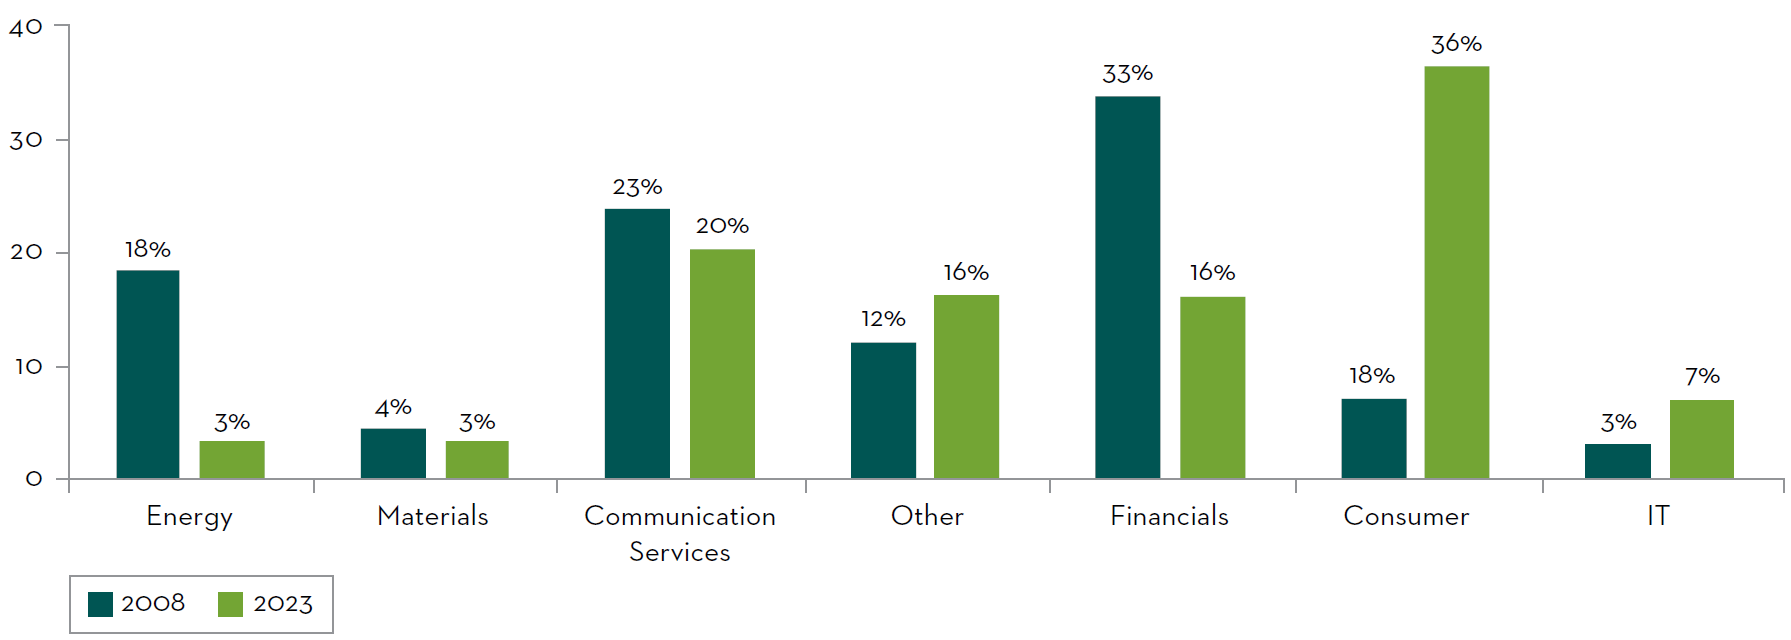
Source: Factset, MSCI and KraneShares CSI China Internet ETF as at 31 December 2023.
Investors may believe that consumer staples are a large part of the Chinese market, however this is limited to c.5% of the index. In contrast, consumer discretionary names (c.30% of index) are largely exposed to new economy names. Chinese internet stocks are distributed across both the consumer discretionary and communication services sectors, by analysing the weighting of Chinese internet holdings within MSCI China as a whole, we can distill their current scope of importance within the Chinese equity market3.
How meaningful an exposure are Chinese internet stocks?
Chinese internet stocks now account for nearly 40% of MSCI China and nearly 11% of MSCI Emerging Markets.
To provide context, these internet stocks have a higher weighting within emerging markets than the countries of Brazil and Mexico combined (6.4% and 4.2% respectively)4.
| 2019 | 2020 | 2021 | 2022 | 2023 | |
|---|---|---|---|---|---|
| China Internet % of MSCI China | 37.7 | 44.5 | 36.5 | 39.1 | 40.0 |
| China Internet % of MSCI Emerging Markets | 12.9 | 17.4 | 11.8 | 12.6 | 10.6 |
Source: Bloomberg, as at 29 April 2024.
Internet sector versus MSCI China
Looking at the internet sector from a financial metric perspective, we see that overall it has delivered far superior quality (measured by returns on capital and leverage) and growth over MSCI China (measured by sales and earnings per share growth). The current valuation of the sector is compelling given its superior history of delivering quality and growth.
Quality/growth/valuation attributes
| China Internet | MSCI China | |
|---|---|---|
| Sales growth 5 years | 2.3 | (0.4) |
| EPS growth 5 years | 35.1 | 20.4 |
| Return on capital | 8.3 | 6.2 |
| Debt/equity | 23.6 | 87.3 |
| Forward P/E | 12.5 | 8.9 |
Source: Bloomberg as at 31 March 2024.
When looking at the two largest constituents of the Chinese internet space, Tencent and Alibaba, valuations are sitting at multi-decade lows. Alibaba is currently at 8.7x price-to-earnings (P/E) ratio and Tencent is at 13.7x.
Best P/E ratio
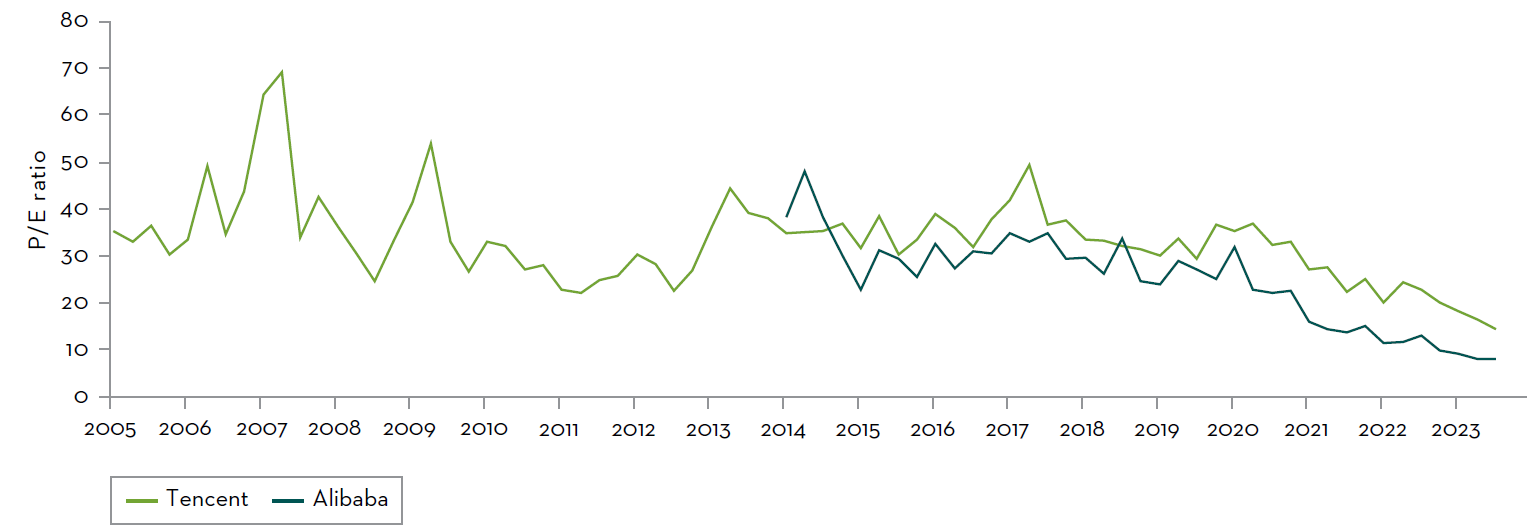
Source: Bloomberg, as at 29 April 2024.
The emerging theme of shareholder returns
Many stocks in the internet sector are proactively increasing shareholder returns. In the first quarter of 2024 many of the large companies in the space announced new dividends and buyback policies5. These should support share prices and investor sentiment. Below are recent details from the two largest names in the space:
- Alibaba: Committed $35bn to be spent on buybacks, evenly over 3 years, alongside regular annual dividends. Given the current market cap of $190bn this buyback is nearly 18% of market cap6.
- Tencent: Committed to double the share buyback this year from $6.3bn in 2023 to $12.8bn in 2024. Upsize the regular dividend to $4.0bn (+42% year-on-year) – together they represent a 5% yield7.
Generally speaking, we are seeing a trend within the Chinese corporate ecosystem of announcing more shareholder friendly policies (higher payouts or buybacks in the most recent results season). This creates some support to buoy foreign investor sentiment while the national team continues to buy mainland Chinese ETFs. Chinese state owned assets have also been focusing on increasing shareholder returns and recent compensation changes align the State Assets Supervision and Adminstration Commission (SASAC) entities with a performance of share price return8.
The Artificial Intelligence (AI) opportunity
Finally, we have seen increasing focus from the digital giants on AI monetisation. The companies are already speaking about the impact that AI tools are having on monetisation of their respective customer bases. For example, in the case of Tencent, the management team has been growing their advertising revenue in the video accounts format, which has been coupled with an AI tool to create better consumer targeting and ad conversion7. Alibaba, during a recent investor road trip to its headquarters in Hangzhou, commented on the use of adtech (advertising technology) and algo tools (algorithm tools) to increase the take-up rate of both Taobao and Tmall9 (online shopping platforms).
How does China’s internet sector compare to US?
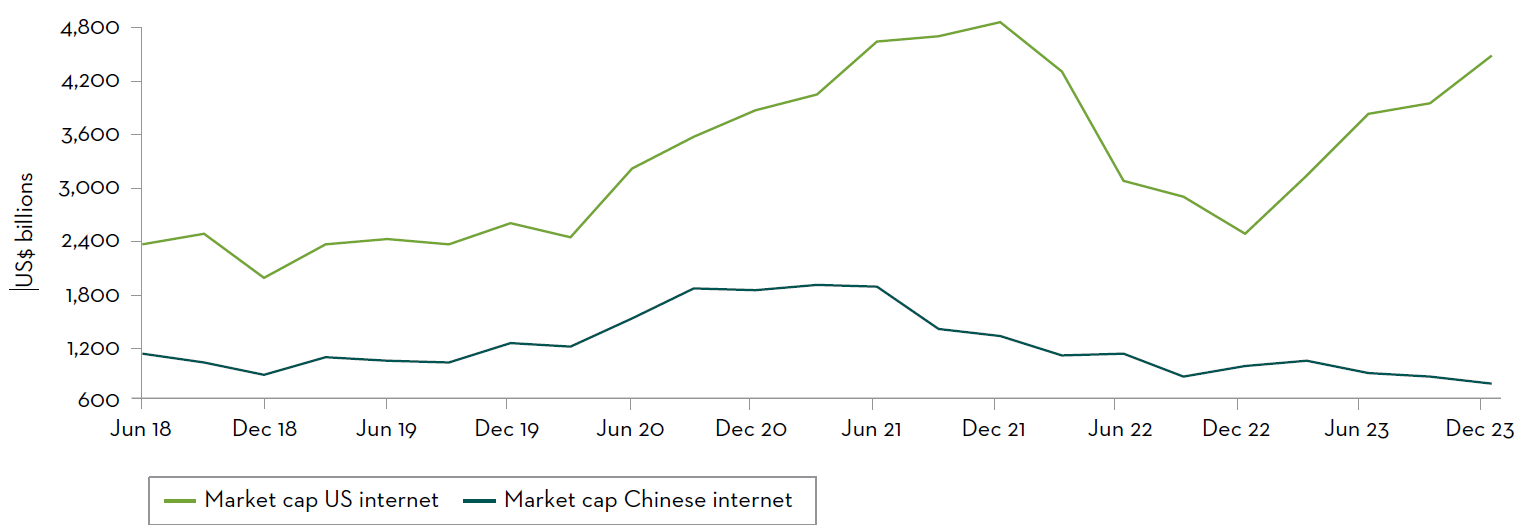
Interestingly enough, Chinese internet names have not underperformed from the perspective of revenue growth. Below we track the cumulative revenue of the big four Chinese internet names (Tencent, Alibaba, Meituan, PDD) relative to the largest US internet stocks (Alphabet, Amazon, Meta, Netflix). However, the market experience of these businesses have dramatically diverged.
Market cap: US internet versus China internet
Revenue of China and US internet companies
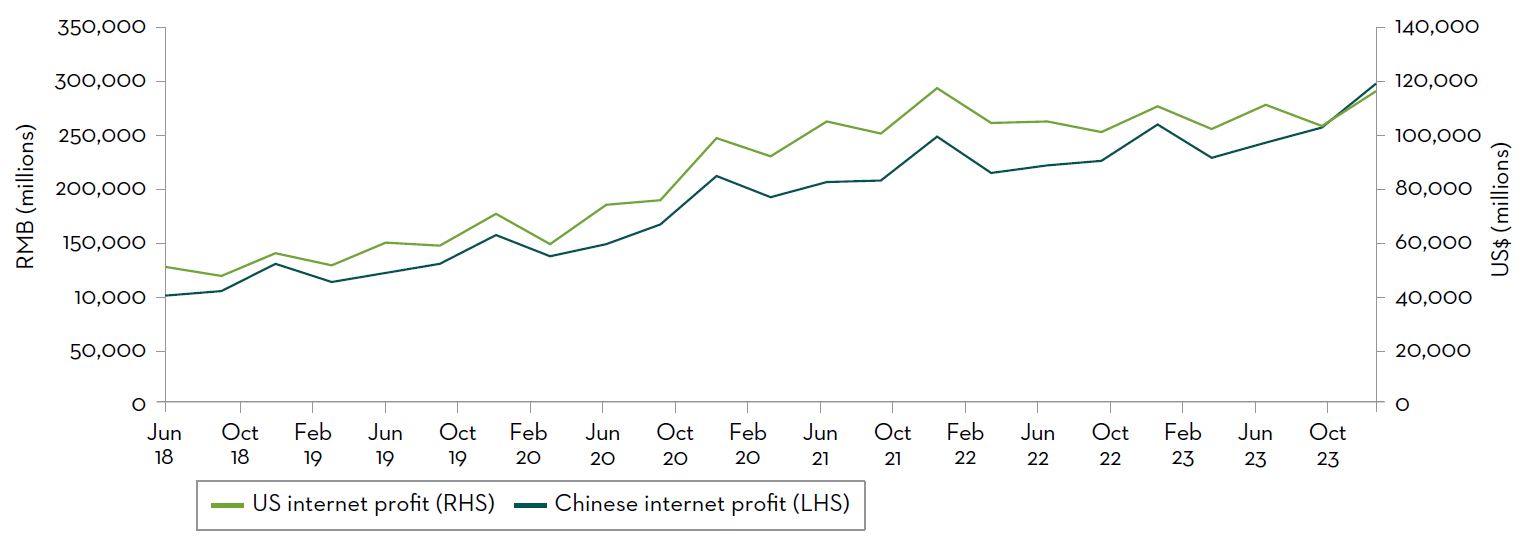
Source: Bloomberg and Bank of America, as at 31 December 2023. Chinese internet names (Tencent, Alibaba, Meituan, PDD) relative to US internet names (Alphabet, Amazon, Meta, Netflix).
Chinese internet stocks may be set to benefit from three key drivers
To sum up, we believe that most investors do not realise that MSCI China is more heavily weighted toward consumption than the broader Chinese economy (i.e. property and fixed asset investments). Chinese internet giants are taking advantage of the AI opportunity at present and are playing a critical component of the digital transformation as well as a recovery in consumption.
The risk for global asset owners is that exposure in these names has diminished significantly over the last few years as we highlighted earlier. For Martin Currie’s Emerging Markets strategy, we believe that the time is now to own Chinese internet stocks. Exposure to these companies represents nearly 11% of our portfolio7 and is poised to benefit from three key drivers.
First, a return of general Chinese consumption and positive consumer sentiment.
Second, continued strong earnings momentum and increasing shareholder returns. Finally, we believe that these quality growth names in China are offering compelling intrinsic and relative value.
Sources
1Source: National Bureau of Statistics of China, January 2024
2Source: Martin Currie and the MSCI as at 31 December 2023.
3Source: FactSet and KraneShares CSI China Internet ETF as at 31 March 2024.
4Source: Bloomberg, as at 29 April 2024.
5Source: Bloomberg as at 20 March 2024.
6Source: Bloomberg and Alibaba, April 2024. Alibaba December Quarter 2023 results, 7 February 2024.
7Source: Bloomberg and Tencent, April 2024. 2023 Annual and fourth quarter results, 20 March 2024.
8Source: Supervision and Administration Commission of the State Council (SASAC), 31 January 2024.
9Source: Goldman Sachs as at 29 March 2024. China Internet Trip takeaways: Reigniting core business growth; Buy.
Important Information
The information provided should not be considered a recommendation to purchase or sell any particular strategy / fund / security. It should not be assumed that any of the security transactions discussed here were or will prove to be profitable.
This information is issued and approved by Martin Currie Investment Management Limited (‘MCIM’), authorised and regulated by the Financial Conduct Authority. It does not constitute investment advice. Market and currency movements may cause the capital value of shares, and the income from them, to fall as well as rise and you may get back less than you invested.
The information contained in this document has been compiled with considerable care to ensure its accuracy. However, no representation or warranty, express or implied, is made to its accuracy or completeness. Martin Currie has procured any research or analysis contained in this document for its own use. It is provided to you only incidentally and any opinions expressed are subject to change without notice.
The document does not form the basis of, nor should it be relied upon in connection with, any subsequent contract or agreement. It does not constitute, and may not be used for the purpose of, an offer or invitation to subscribe for or otherwise acquire shares in any of the products mentioned.
Past performance is not a guide to future returns.
The distribution of specific products is restricted in certain jurisdictions, investors should be aware of these restrictions before requesting further specific information.
The views expressed are opinions of the portfolio managers as of the date of this document and are subject to change based on market and other conditions and may differ from other portfolio managers or of the firm as a whole. These opinions are not intended to be a forecast of future events, research, a guarantee of future results or investment advice.
Some of the information provided in this document has been compiled using data from a representative account. This account has been chosen on the basis it is an existing account managed by Martin Currie, within the strategy referred to in this document.
Representative accounts for each strategy have been chosen on the basis that they are the longest running account for the strategy. This data has been provided as an illustration only, the figures should not be relied upon as an indication of future performance. The data provided for this account may be different to other accounts following the same strategy. The information should not be considered as comprehensive and additional information and disclosure should be sought.
The information provided should not be considered a recommendation to purchase or sell any particular strategy / fund / security. It should not be assumed that any of the securities discussed here were or will prove to be profitable.
It is not known whether the stocks mentioned will feature in any future portfolios managed by Martin Currie. Any stock examples will represent a small part of a portfolio and are used purely to demonstrate our investment style.
Risk warnings – Investors should also be aware of the following risk factors which may be applicable to the strategy shown in this document.
- Investing in foreign markets introduces a risk where adverse movements in currency exchange rates could result in a decrease in the value of your investment.
- This strategy may hold a limited number of investments. If one of these investments falls in value this can have a greater impact on the strategy’s value than if it held a larger number of investments.
- Smaller companies may be riskier and their shares may be less liquid than larger companies, meaning that their share price may be more volatile.
- Emerging markets or less developed countries may face more political, economic or structural challenges than developed countries. Accordingly, investment in emerging markets is generally characterised by higher levels of risk than investment in fully developed markets.
- The strategy may invest in derivatives Index futures and FX forwards to obtain, increase or reduce exposure to underlying assets. The use of derivatives may result in greater fluctuations of returns due to the value of the derivative not moving in line with the underlying asset. Certain types of derivatives can be difficult to purchase or sell in certain market conditions.
For wholesale investors in Australia:
This material is provided on the basis that you are a wholesale client within the definition of ASIC Class Order 03/1099. MCIM is authorised and regulated by the FCA under UK laws, which differ from Australian laws.
For professional investors in Canada.
This material is intended for residents in, or incorporated in, Canada and are a Permitted Client for the purposes of MI 31-103. The information on this section of the website is not intended for use by any other person, including members of the public.
Martin Currie Inc, incorporated in New York with its registered office at 280 Park Avenue, New York, NY 10017 and having a UK branch registered in Scotland (no SF000300), Head office, 5 Morrison Street, 2nd floor, Edinburgh, EH3 8BH, Tel: +44 (0) 131 229 5252 Fax: +44 (0) 131 222 2532 www.martincurrie.com, operates under the International Adviser Exemption with the Ontario Securities Commission (‘OSC’) and is therefore currently not required to be registered as a portfolio manager for the purposes of MI 31-103. Martin Currie Inc. is also authorised by the UK Financial Conduct Authority.
For the avoidance of doubt, nothing excludes, limits or restricts our obligations to you under the UK Financial Services and Market Act 2000, National Instruments or any other applicable law or regulation.
The opinions and views in this website do not take into account your individual circumstances, objectives, or needs and are not intended to be recommendations of particular financial instruments or strategies to you.
This website does not identify all the risks (direct or indirect) or other considerations which might be material to you when entering any financial transaction. You should consult with your professional advisers before undertaking any investment activity. The information provided on this website should not be treated as advice or a recommendation to buy or sell any particular security or other investment. The information on this website has not been reviewed by any competent regulatory authority.
For professional investors:
In the People’s Republic of China:
This document does not constitute a public offer of the strategy, whether by sale or subscription, in the People’s Republic of China (the “PRC”). These strategies are not being offered or sold directly or indirectly in the PRC to or for the benefit of, legal or natural persons of the PRC.
Further, no legal or natural persons of the PRC may directly or indirectly purchase any of the strategy or any beneficial interest therein without obtaining all prior PRC’s governmental approvals that are required, whether statutorily or otherwise. Persons who come into possession of this document are required by the issuer and its representatives to observe these restrictions.
In Hong Kong:
The contents of this document have not been reviewed by any regulatory authority in Hong Kong. You are advised to exercise caution in relation to the offer. If you are in any doubt about any of the contents of this document, you should obtain independent professional advice.
In South Korea:
This document is for information purposes only. It is prepared and presented to provide an introduction to the business of MCIM and its related companies (collectively known as ‘Martin Currie’). This document does not constitute an offer to sell or a solicitation of any offer to invest in any security, fund or other vehicle managed or advised by Martin Currie.
None of the security(ies), fund(s) or vehicle(s) managed by or advised by Martin Currie are registered in South Korea under the Financial Investment Services and Capital Markets Act of Korea and accordingly, none of these instruments nor any interest therein may be offered, sold or delivered, or offered or sold to any person for re-offering or resale, directly or indirectly, in South Korea or to any resident of South Korea except pursuant to applicable laws and regulations of South Korea.
Martin Currie is not registered with or regulated by any regulatory authorities in South Korea.
Franklin Distributors, LLC. Member FINRA opens a dialog, SIPC opens a dialog. All entities mentioned are Franklin Templeton affiliated companies. Investment Products: NOT FDIC INSURED | NO BANK GUARANTEE | MAY LOSE VALUE