Content navigation
We continue to explore the Magnificent Seven stocks. Our initial report published in June 2024, highlighted that not all of the Magnificent Seven stocks qualify as magnificent, when capturing their growth and returns profile, in conjunction with the valuation at which they are trading at the present time. Highlighting the need to be selective.
In this latest report, we cover the wider range of sales/earnings estimates revisions, the challenges presented to active managers by the significant performance of these stocks and preponderance in indices, and the disruption from Artificial Intelligence (AI) and regulatory risk.

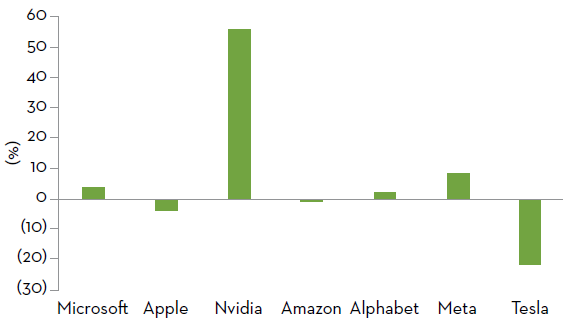
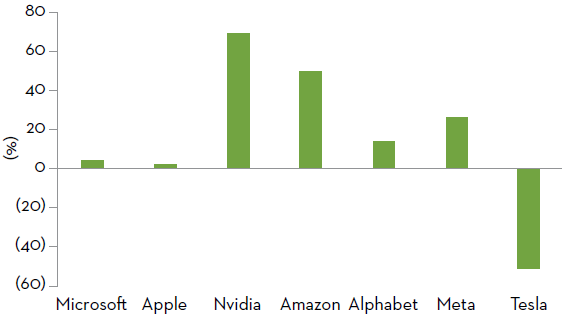
Estimates revisions have been in a broad range across the seven stocks, these range from -21% to +56% on sales revisions over 12 months, and from -52% to +70% on earnings revisions over 18 months1.

Market narrowness on the Magnificent Seven has provided a concentration challenge for active managers and asset allocators. The ‘Fundamental Law of Active Management’ (Grinold 1989, Grinold & Kahn, 2020)2 highlights that stock picking skill alone is not sufficient in such environment: stock pickers need breadth to express their skill successfully.

Capex intensity, as a result of the arms race triggered by the rapid advances of AI over the past 18 months, is speeding up the risk of disruption within big tech. These sizeable investments to harness AI will bring more focus on whether the return on AI investment (RoAII), will either dilute or enhance the current ROICs.

Big tech boundaries of specialisation are blurring – big tech companies are moving into each other’s spaces, increasing competitive intensity risk. Apple could be positioning itself as the most neutral agent within the AI race, thus leveraging its privileged position within devices, but also increasing its risk of becoming obsolete in the medium term.

Nvidia and Microsoft earn themselves the characteristics of the Formidable Two companies from the Magnificent Seven based on our analysis. Apple is well positioned across the various measures we assess, notably for its strategic positioning on AI neutrality.
-
There has been a broad range of sales and earnings revisions across the various stocks within the Magnificent Seven, which highlights the importance of being stockspecific.
The need to be selective
Recapping our previous report ‘The Formidable Two’, we find that on a multi-dimensional assessment, based on a combination of growth profile, return on invested capital (ROIC) profile and price-to-earnings (P/E) ratio, some stocks within the Magnificent Seven do look attractive, whilst others do not have as appealing a profile for investors, and therefore are not all that magnificent.
Looking at valuation on its own does not capture the growth profile differential of the seven stocks, given the broad range of growth amongst them. This goes from +10% to +60% based on the forecast three years compound annual growth rate (CAGR) earnings growth. Based on two years CAGR from 2024-26E, that range remains wide, albeit less so, at +11% to +38%. Similarly, looking at valuations in conjunction with growth profiles does not capture the different levels of returns that companies in the Magnificent Seven exhibit, with ROICs ranging from c.10% to c.70%, based on consensus estimates for this year.
Instead, we find a Price/Earnings to Growth (PEG)-ROIC ratio does capture the three dimensions of valuation, earnings growth, and ROIC profiles, to give a more accurate measure of which stocks are truly magnificent at the moment. On that basis, Nvidia remains the standout stock in the Magnificent Seven, and earns the characteristic of being ‘formidable’. Tesla and Amazon appear to be more expensive based on that ratio, whilst the remaining four stocks (Microsoft, Apple, Alphabet and Meta) appear to be in a narrower cluster.
In this report we bring in the estimate momentum dimension into consideration. Estimates revisions have been in a broad range across the seven stocks, these range from -21% to +56% on sales revisions over 12 months, and from -52% to +70% on earnings revisions over 18 months.
Harder to quantify but no less important to consider are the fundamental risks that differentiate various companies amongst the Magnificent Seven. Each stock in the basket faces different industry dynamics, and therefore different ranges of risks related to competition, new entrants, customer power, and pricing power. These stocks also face a differing range of innovation and disruption risks into the future. Finally, regulatory risk is also an important dimension to consider for these stocks, given their size, and the influence that they therefore exert in the markets in which they operate. This is illustrated in the following report by the recent (2024) antitrust case faced by Alphabet.
Source: Source for all data FactSet as at 7 October 2024.
Estimate momentum is broad ranging across the Magnificent Seven stocks
Estimate revisions have been in a broad range across all the Magnificent Seven stocks, as can be seen in the charts below. Sales consensus estimates for 2024 saw a significant cut of -21% for Tesla, whilst Nvidia has seen its sales estimates upgraded by +56%. Meta has seen its sales upgraded by 8% over the past 12 months, whilst the others have ranged from -4% to +4%. Over 18 months, sales revisions for 2024E have ranged from -27% for Tesla, to +238% for Nvidia, with Meta sales revised up by +19%, whilst the other companies have been in a narrower range of -6% to +6%.
Sales 2024E revisions 12 months (%)
Earnings 2024E revisions 12 months (%)
Source: FactSet as at 7 October 2024.
On earnings estimates, consensus has cut Tesla by -52%, whilst Nvidia has seen a significant upgrade of +70%. Amazon also saw a sizeable upgrade of +50% over the past 12 months. Meta has also had a meaningful upgrade of +26%, with Alphabet coming behind with +14%. Over 18 months, earnings revisions for 2024E range from -60% for Tesla, to +367% for Nvidia, +71% for Meta, +89% for Amazon, +26% for Alphabet.
Similarly to our observations across growth, ROIC and P/E multiples, there has been a broad range of sales and earnings revisions across the various stocks within the Magnificent Seven, which highlights the importance of being stockspecific.
Narrow market leadership has been a challenge for active managers and asset allocators
Narrow market leadership provided by the Magnificent Seven over the past 18 months has been a challenge for both active portfolio managers, and asset allocators alike.
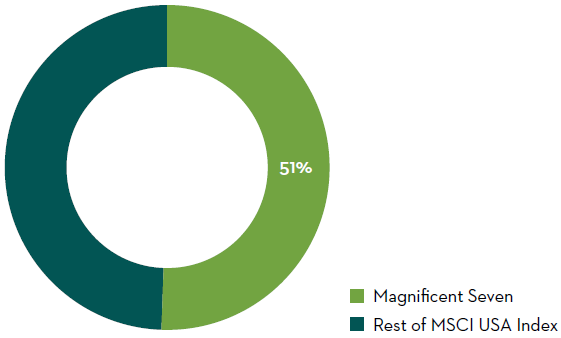
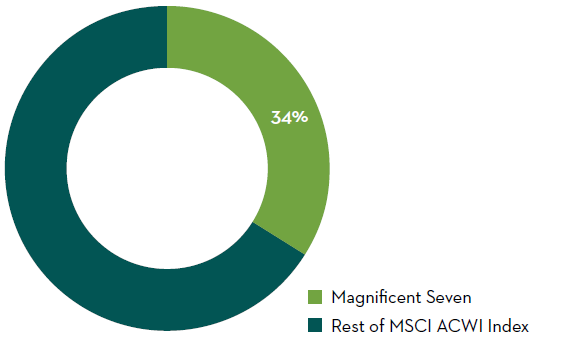
Year-to-date, as we write, the Magnificent Seven stocks have accounted for c.49% of the MSCI USA Index return, and c.32% of the MSCI ACWI Index. Over the past 18 months, these stocks have accounted for c.51% of the MSCI USA Index return, and c.34% of the MSCI ACWI Index return3. This highlights how narrow market leadership has been.
Return of Magnificent Seven over 18 months versus MSCI USA
Return of Magnificent Seven over 18 months versus MSCI ACWI
Source: FactSet as at 7 October 2024.
This market narrowness, and concentration in index performance have challenged many skilled active managers, and goes to the heart of the fundamental law of active management, as expressed by Richard Grinold (1989), and as detailed in “Advances in active portfolio management” by Richard Grinold and Ronald Kahn (2020)4.
The fundamental law of active management relates managers’ level of skill, and breadth of skill to their potential to deliver risk-adjusted returns for clients. Breadth of skill is the opportunity to diversify across independent investment decisions over the course of a year. Please note that breadth (Br) is the number of independent decisions per year and is not the same thing as the number of portfolio holdings.
The fundamental law of active management relates managers’ level of skill, and breadth of skill to their potential to deliver risk-adjusted returns for clients. Breadth of skill is the opportunity to diversify across independent investment decisions over the course of a year. Please note that breadth (Br) is the number of independent decisions per year and is not the same thing as the number of portfolio holdings.
Grinold and Kahn write that according to this fundamental law, the expected information ratio of an active investment strategy (its ratio of exceptional active return to active risk) is:

The information coefficient, or IC, is a measure of skill in each investment decision. It is the correlation of forecasts with subsequent realisations. Grinold and Kahn define breadth as the number of investment decisions an active manager makes per year. High information ratios follow from high levels of skill and/or high breadth or diversification, write the authors.
Concentration risk within indices has indeed become a challenge for asset allocators and portfolio managers alike, with the challenge of skilled managers not being able to deploy their stock picking abilities due to lack of market breadth.
Disruption could be accelerating and risks increasing
With the significant increase in capex being spent by big tech companies to harness AI, in our view there is an increased risk of acceleration in the pace of disruption.
We estimate that Alphabet, Amazon, Microsoft and Meta have increased their capex plans for the next three years (2024-27) by almost USD130bn, adding to the already significant spending that they had been planning. This is in response to the AI opportunity materialising faster through the course of 2023, we show this in the chart below.
Cloud Hyperscalers & Meta Capex
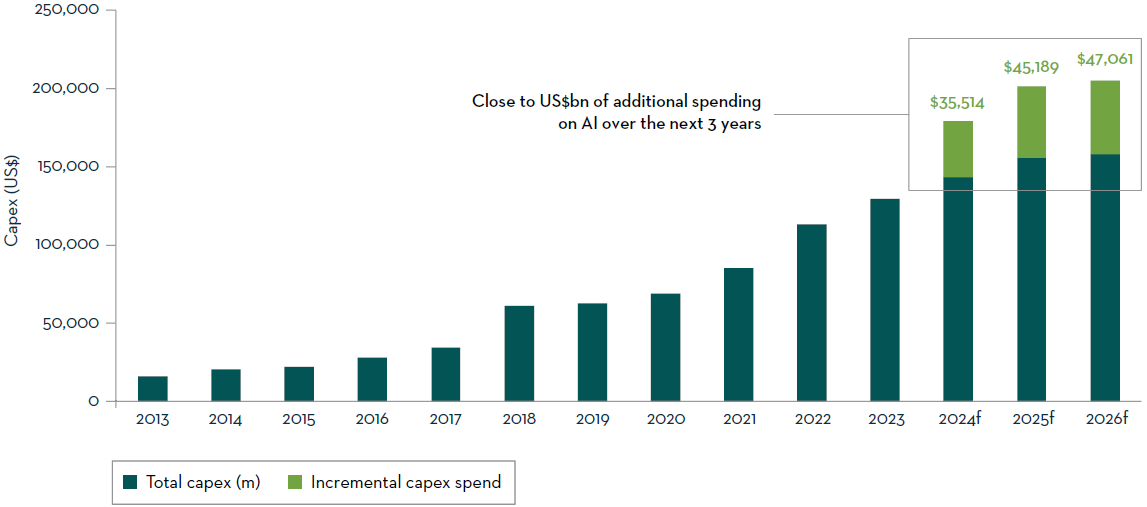
Source: Source: Martin Currie and FactSet, as at 24 May 2024.
This outsized increase in capex planning is likely to be channelled into making the cloud infrastructure of these companies AI ready, to enable a better capture of this opportunity in general.
With such sizeable investments being deployed to harness AI, investors will be increasingly focused on assessing whether the RoAII will justify the outsized investment, or be dilutive to existing ROICs, and therefore whether current valuations are justified.
Our discussions with big tech companies on this topic point to two aspects: 1) big tech companies expect this investment in AI to not dilute ROICs over time, and 2) that there is reluctance to give much precise information for investors to do their own calculations.
Competition is intensifying amongst big tech as AI is pushing them to move into each other’s space
The Magnificent Seven have each historically dominated distinct core markets: Meta in social networks, Apple in consumer electronics, Alphabet in search engines, Microsoft in enterprise software, Tesla in electric vehicles, Amazon in e-commerce, and Nvidia in graphics processing units (GPUs). Over time, these giants have aggressively diversified into adjacent areas that align with their core strengths. However, recent advancements in AI, particularly in large language models, are disrupting multiple sectors. We now see heightened competition across the internet search engines, cloud, consumer electronics, and autonomous robotics markets as these companies push into each other’s territories.
In cloud infrastructure, where Amazon, Microsoft, and Google previously maintained stable pricing dynamics, competition is intensifying as all three ramp up their AI capabilities. These firms are now competing directly in AI with models such as OpenAI’s GPT (supported by Microsoft), Google’s Gemini, and Meta’s LLaMA. However, Alphabet faces an innovator’s dilemma5, as its high-margin search business is increasingly disrupted by chatbot-driven queries – a far more competitive market that also demands significantly higher compute power, raising costs and pressuring margins. As AI development accelerates, rising capital demands to acquire Nvidia GPUs are prompting companies to invest in proprietary chips to reduce reliance on Nvidia's technology.
In Augmented Reality (AR) and Virtual Reality (VR), Apple and Meta have emerged as key players with contrasting strategies. Apple leverages its premium brand and vast device ecosystem – over 2 billion active devices – to price the Vision Pro headset at US$3,5006, minimising potential cannibalisation of its high-margin product lineup. This pricing aligns with Apple’s approach in consumer electronics, where it holds a 20% share of a smartphone market but captures approximately 50% of the industry's US$420bn revenues and 80% of profits7.
Meta, by contrast, has no incumbent position in consumer electronics and faces a “cold start” problem in VR. To address this, Meta has adopted a massmarket strategy with the Quest 2 priced at US$3008, significantly below the Vision Pro, to build a broad base of users and developers. Meta’s Reality Labs posted a US$13.7 billion loss in 2022 against US$2.2 billion in revenue9 – a calculated move to prioritize market penetration over immediate profitability. Microsoft and Meta, benefiting from low overlap between Microsoft’s enterprise foothold and Meta’s social media dominance, have also formed a partnership in 2022, to leverage Microsoft's enterprise software and Xbox onto the Meta quest platform.
Meanwhile, Tesla has moved beyond electric vehicles, furthering its investment in AI with its "full-self-driving" capabilities and the Dojo supercomputer. This expansion increasingly overlaps with Nvidia’s industrial automation ambitions through its Omniverse platform, underscoring the broader trend of big tech's ongoing convergence and intensifying competition across AI, cloud, and immersive technologies.
Apple as the ‘Switzerland’ of AI in terms of neutrality
In amongst this intensifying competition and accelerating disruption risk brought up by AI, Apple has the opportunity to take a more neutral stance within AI, and be the ‘Switzerland’ of AI as a result. Whether this is by choice, or because it has found itself left behind in the AI race, Apple, through its dominant market share in devices, and therefore privileged gateway to the users, is able to offer its users access to a range of AI services. OpenAI has managed to get itself in a position whereby it will be able to be one of the choices of AI search engines offered to the Apple users, alongside Google. Apple could also seek to extend agreements on AI search engines beyond Google and OpenAI, with market talks at present about Anthropic and Perplexity being in negotiation. Meta has reportedly been dropped for now over privacy concerns by Apple, but could come back to the table in future.
2026 estimated capex of Apple versus the cloud hyperscalers (US$ billions)
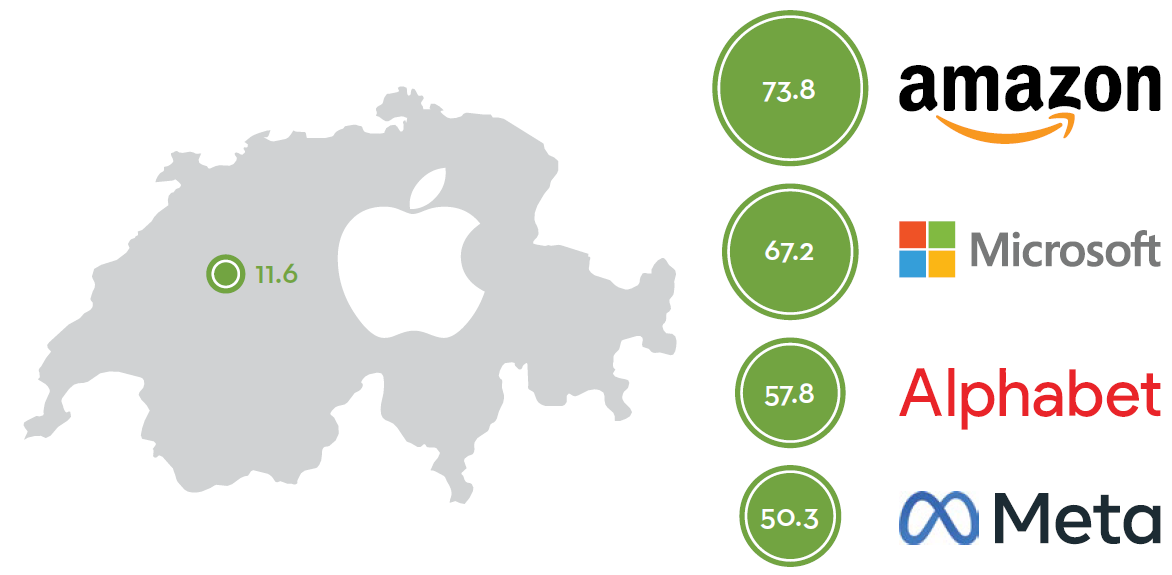
Circles correspond to the relative size of the company’s estimated 2026 capex.
Source: Martin Currie and Bloomberg as at 7 October 2024, using company published financial information.
Apple can in effect be in a very enviable position whereby it can monetise the AI opportunity, without having had to spend the outsized capex that is being spent by the cloud providers, as discussed above. This neutrality within the AI arms race could be providing Apple with the opportunity to not have to take part in the race, but also opens the company up to higher risk of being disrupted away, and becoming obsolete, should companies like Meta be able to find the next cutting edge hardware device to capture more users. Apple could in that instance be in a similar position to RIM’s BlackBerry in the 2000s, failing to take an important turn in the disruption race, and finding itself out of the race altogether.
What next steps Apple takes to tackle the AI opportunity will therefore be critical to watch.
Alphabet’s antitrust case highlights the regulatory and disruption risks faced by the company
Alphabet’s largest and best-known company, Google, has been the subject of antitrust investigation by the US Department of Justice (DoJ) for several years, principally regarding the monopolisation of the digital advertising industry. Advertising (and related streams) account for around 80% of Alphabet revenues, the outsized contributor (~60% of this)10 being Google’s mainstream Search advertising business. It is not uncommon for advertising businesses to pay Traffic Acquisition Costs (TAC) to online digital publishers, in return for permission to advertise on their inventory. However, in 2024, the DoJ successfully argued that the quantum of Google's payments was egregious.
They cite annual TAC in excess of US$20bn11 being paid to Apple in return for Google remaining the default search engine on Safari web browsers. According to the DoJ and Judge Amit Mehta12, payments of this nature effectively make it impossible for smaller search engines to compete with Google. This means that share of eyeballs, thus advertising dollars, remain deeply embedded in the Google advertising ecosystem. Proposed remedies include consumer choice screens upon iPhone setup, limits on Google's ability to pay TAC, and the most extreme, a breakup of Google's applications into standalone businesses (e.g. Chrome/Android).
We are unlikely to see a swift resolution as Google is expected to appeal whatever remedies Judge Mehta proposes in the months ahead, a process that could take several years. Apple-related advertising sales account for around 30% of Google search revenue13, and a second DoJ antitrust case focussed on Google's AdTech stack is currently underway; closing arguments are scheduled for November.
Therefore, the risk to Google's top line as well as a breakup that would materially lower barriers to entry in its core advertising business is increasingly priced in by investors. Whilst Alphabet has plenty of cash to vehemently defend its core business, we think that this lengthy overhang will continue to weigh on relative returns versus alternative big tech opportunities.
The Magnificent Seven need to be assessed on a case-by-case basis
All in all, whilst the Magnificent Seven basket might have tended to be seen as a homogenous basket, it is important to assess each company on an individual basis, given the varying industry dynamics that they all face, as well as the varying degree of disruption and innovation risks that they are exposed to. Each company also emanates a different range of abilities to fend off the disruptions they face. Disruption risks are increasing for all of these companies, notably given that each of them seems to be moving into each other’s spaces.
Outsized investments to harness the AI opportunity will increasingly bring the spotlight on whether the return on AI investment will be supportive to the ROIC profile of these businesses. Additionally, each company has varying degrees of regulatory risks, which also need to be assessed on a caseby- case basis. Finally, each of these companies have different ranges of growth and returns profiles, and have different valuations, which therefore need to be taken into consideration when assessing relative attraction of each stock within that basket.
A selective fundamental approach to picking the most attractive stocks within the Magnificent Seven is warranted in our view. Market concentration and narrowness have challenged the fundamental law of active management, but we believe that over the medium term, fundamentals should assert themselves, and the market will be more discerning about which companies offer the most appealing combination of growth, returns and valuation support. This will favour long-term investors and skilled stock pickers.
We find that taking all dimensions into account, Nvidia and Microsoft earn themselves the characteristics of the Formidable Two companies amongst the Magnificent Seven basket; Apple is well positioned across the various measures we assess, notably for its AI neutrality strategic positioning.
Sources
1Source: Factset as at 7 October 2024.
2Source: Richard C. Grinold 1989 and, Richard C. Grinold and Roland Kahn ‘Advances in active portfolio management’ 2020.
3Source: FactSet as at 16 October 2024.
4Source: Richard C. Grinold 1989 and, Richard C. Grinold and Roland Kahn ‘Advances in active portfolio management’ 2020.
5Source: Ahe innovator’s dilemma, specifically this is the risk of an established company failing to innovate to remain competitive, and missing new technological developments that end up challenging its established position. As described in the book ‘The Innovator’s Dilemma’ (1997), by Professor Clayton Christensen.
6Source: Apple website as at 18 October 2024
7Source: Martin Currie internal estimates as at 7 October 2024. Based on company published financial information.
8Source: Meta.com as at 18 October 2024.
9Source: Martin Currie and Meta as at 1 February 2023. Based on Meta’s 4th quarter and full year 2022 results.
10Source: Martin Currie internal estimates as at 7 October 2024. Based on company published financial information.
11Source: Bloomberg as at 20 May 2024.
12Source: Judge Amit Mehta is the Judge of the United States District Court for the District of Columbia.
13Source: BBC News as at 23 November 2023. https://www.bbc.com/news/business-67417987
Important Information
This information is issued and approved by Martin Currie Investment Management Limited (‘MCIM’), authorised and regulated by the Financial Conduct Authority. It does not constitute investment advice. Market and currency movements may cause the capital value of shares, and the income from them, to fall as well as rise and you may get back less than you invested.
The information contained in this document has been compiled with considerable care to ensure its accuracy. However, no representation or warranty, express or implied, is made to its accuracy or completeness. Martin Currie has procured any research or analysis contained in this document for its own use. It is provided to you only incidentally and any opinions expressed are subject to change without notice.
This document is intended only for a wholesale, institutional or otherwise professional audience. Martin Currie Investment Management Limited does not intend for this document to be issued to any other audience and it should not be made available to any person who does not meet this criteria. Martin Currie accepts no responsibility for dissemination of this document to a person who does not fit this criteria.
The document does not form the basis of, nor should it be relied upon in connection with, any subsequent contract or agreement. It does not constitute, and may not be used for the purpose of, an offer or invitation to subscribe for or otherwise acquire shares in any of the products mentioned.
Past performance is not a guide to future returns.
The distribution of specific products is restricted in certain jurisdictions, investors should be aware of these restrictions before requesting further specific information.
The views expressed are opinions of the portfolio managers as of the date of this document and are subject to change based on market and other conditions and may differ from other portfolio managers or of the firm as a whole. These opinions are not intended to be a forecast of future events, research, a guarantee of future results or investment advice.
Please note the information within this report has been produced internally using unaudited data and has not been independently verified. Whilst every effort has been made to ensure its accuracy, no guarantee can be given.
Some of the information provided in this document has been compiled using data from a representative account. This account has been chosen on the basis it is an existing account managed by Martin Currie, within the strategy referred to in this document.
Representative accounts for each strategy have been chosen on the basis that they are the longest running account for the strategy. This data has been provided as an illustration only, the figures should not be relied upon as an indication of future performance. The data provided for this account may be different to other accounts following the same strategy. The information should not be considered as comprehensive and additional information and disclosure should be sought.
The information provided should not be considered a recommendation to purchase or sell any particular strategy/fund/security. It should not be assumed that any of the securities discussed here were or will prove to be profitable.
It is not known whether the stocks mentioned will feature in any future portfolios managed by Martin Currie. Any stock examples will represent a small part of a portfolio and are used purely to demonstrate our investment style.
Risk warnings – Investors should also be aware of the following risk factors which may be applicable to the strategy shown in this document.
- Investing in foreign markets introduces a risk where adverse movements in currency exchange rates could result in a decrease in the value of your investment.
- This strategy may hold a limited number of investments. If one of these investments falls in value this can have a greater impact on the strategy’s value than if it held a larger number of investments.
- Smaller companies may be riskier and their shares may be less liquid than larger companies, meaning that their share price may be more volatile.
- Emerging markets or less developed countries may face more political, economic or structural challenges than developed countries. Accordingly, investment in emerging markets is generally characterised by higher levels of risk than investment in fully developed markets.
For wholesale investors in Australia:
This material is provided on the basis that you are a wholesale client. MCIM has entered an Intermediary arrangement with Franklin Templeton Australia Limited (ABN 76 004 835 849) (AFSL No. 240827) (FTAL) to facilitate the provision of financial services by MCIM to wholesale investors in Australia. Franklin Templeton Australia Limited is part of Franklin Resources, Inc., and holds an Australian Financial Services Licence (AFSL No. AFSL240827) issued pursuant to the Corporations Act 2001.
For professional investors in Canada.
This material is intended for residents in, or incorporated in, Canada and are a Permitted Client for the purposes of MI 31-103. The information on this section of the website is not intended for use by any other person, including members of the public.
Martin Currie Inc, incorporated in New York with its registered office at 280 Park Avenue, New York, NY 10017 and having a UK branch registered in Scotland (no SF000300), Head office, 5 Morrison Street, 2nd floor, Edinburgh, EH3 8BH, Tel: +44 (0) 131 229 5252 Fax: +44 (0) 131 222 2532 www.martincurrie.com, operates under the International Adviser Exemption with the Ontario Securities Commission (‘OSC’) and is therefore currently not required to be registered as a portfolio manager for the purposes of MI 31-103. Martin Currie Inc. is also authorised by the UK Financial Conduct Authority.
For the avoidance of doubt, nothing excludes, limits or restricts our obligations to you under the UK Financial Services and Market Act 2000, National Instruments or any other applicable law or regulation.
The opinions and views in this website do not take into account your individual circumstances, objectives, or needs and are not intended to be recommendations of particular financial instruments or strategies to you.
This website does not identify all the risks (direct or indirect) or other considerations which might be material to you when entering any financial transaction. You should consult with your professional advisers before undertaking any investment activity. The information provided on this website should not be treated as advice or a recommendation to buy or sell any particular security or other investment. The information on this website has not been reviewed by any competent regulatory authority.
For professional investors:
In the People’s Republic of China:
This document does not constitute a public offer of the strategy, whether by sale or subscription, in the People’s Republic of China (the “PRC”). These strategies are not being offered or sold directly or indirectly in the PRC to or for the benefit of, legal or natural persons of the PRC.
Further, no legal or natural persons of the PRC may directly or indirectly purchase any of the strategy or any beneficial interest therein without obtaining all prior PRC’s governmental approvals that are required, whether statutorily or otherwise. Persons who come into possession of this document are required by the issuer and its representatives to observe these restrictions.
In Hong Kong:
The contents of this document have not been reviewed by any regulatory authority in Hong Kong. You are advised to exercise caution in relation to the offer. If you are in any doubt about any of the contents of this document, you should obtain independent professional advice.
In South Korea:
This document is for information purposes only. It is prepared and presented to provide an introduction to the business of MCIM and its related companies (collectively known as ‘Martin Currie’). This document does not constitute an offer to sell or a solicitation of any offer to invest in any security, fund or other vehicle managed or advised by Martin Currie.
None of the security(ies), fund(s) or vehicle(s) managed by or advised by Martin Currie are registered in South Korea under the Financial Investment Services and Capital Markets Act of Korea and accordingly, none of these instruments nor any interest therein may be offered, sold or delivered, or offered or sold to any person for re-offering or resale, directly or indirectly, in South Korea or to any resident of South Korea except pursuant to applicable laws and regulations of South Korea.
Martin Currie is not registered with or regulated by any regulatory authorities in South Korea.
Copyright © 2024 Franklin Templeton. All rights reserved. Investment Products: NOT FDIC INSURED | NO BANK GUARANTEE | MAY LOSE VALUE


