
Content navigation
The past decade and a half has seen India grow tremendously, positioning it to significantly steer the future trajectory of the asset class. This document examines India's transformative journey and the structural changes propelling its rise. The growth driven by these changes has the potential to fuel enhanced consumption and innovation across many sectors.
We believe India’s journey is far from complete; with superior earnings growth forecasted for the coming years, Indian companies are poised to drive forward the broader asset class, promising exciting opportunities for investors.
India’s journey to be a key component of EM equities
India now represents almost 20% of the asset class (chart 1), tied with Taiwan as the second largest country weight in the MSCI Emerging Markets Index at the end of 20241. The past fifteen years’ growth has led to it now being positioned to play a meaningful role in the direction of the asset class as a whole; India’s future can help drive the future of EM.
Chart 1: Weight of India in MSCI EM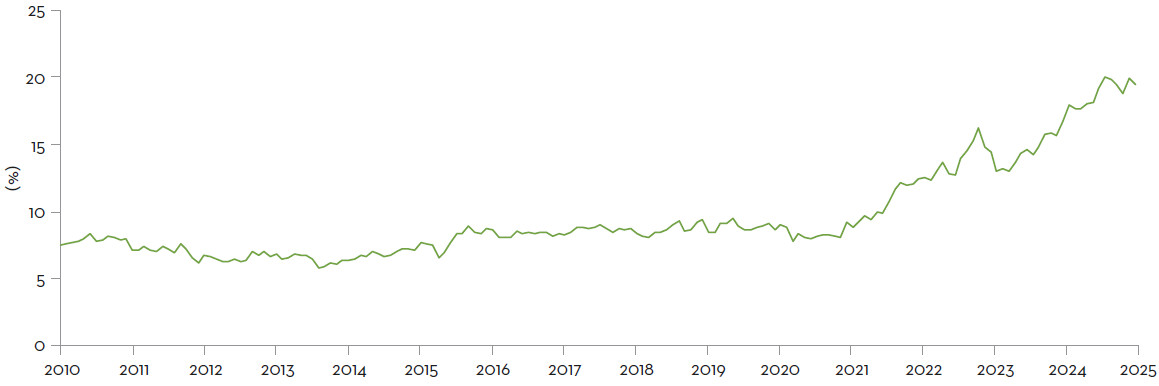
Source: MSCI as at 31 December 2024.
-
We believe India’s journey is far from complete; with superior earnings growth forecasted for the coming years, Indian companies are poised to drive forward the broader asset class, promising exciting opportunities for investors.
The growth in India’s equity markets is reflective of the broader changes it has experienced over the past 25 years. It has grown tremendously across multiple measures. Real gross domestic product (GDP) has grown on average 6.4% per year between 2004 and 20241, while GDP per capita has grown from USD 635 to nearly USD 3,000, or 8.0% annually in the same period (chart 2). This huge increase in national and individual productivity indicates a significant increase in individual wealth. This has implications for growth as higher wealth means more opportunities for consumption, which in turn can lead to higher (and sustainable) growth.
Chart 2: India’s GDP per capita over time
Source: Statista and IMF as at 31 October 2024. Estimated gross domestic product per capita in current prices from 1987 to 2029 (in US dollars).
*Estimates figures.
India’s journey is far from complete
We believe that the delivered and forecast earnings of Indian companies will help drive forward the broader asset class. The next three years consensus forecasts estimate that India will deliver superior earnings growth for shareholders compared to the US and other developed markets (chart 3).
A further indicator of the growth potential in India is the penetration levels for consumption. For many key consumer-related indicators, overall penetration levels remain low. Examples are wide ranging, from the number of credit cards issued in 2024 being double that of five years ago2, to the number of middle-income earners growing at almost 20% annually in the past five years3.
85 million people in India had credit cards at the end of 20234 but despite the huge growth in issuance, this still only represents 6% of India’s population.5
Chart 3: Forecasted earnings growth for next three years)
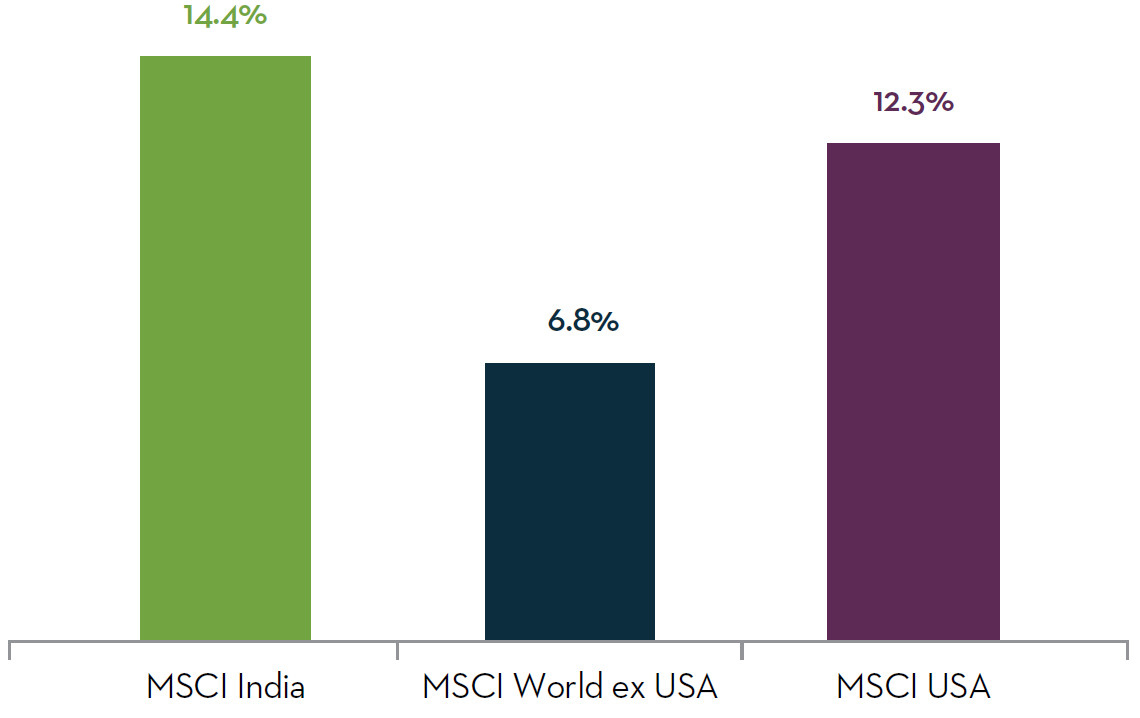
Source: FactSet, as at 6 February 2025. Earnings growth over the three-year period shown using the compound annual growth rate of earnings-per-share from 1 January 2025 to 31 December 2027. There is no assurance that any estimate, forecast or projection will be realised.
With India’s increased wealth, there is a significant opportunity for these levels to increase and support higher consumption in many areas.
There are a lot of people coming into the middle class and I really feel that India is at tipping point
Tim Cook, CEO, Apple Inc
Apple Q2 2023 earnings call as at 4 May 2023.
[Prime Minister Narendra Modi] and India are in an analogous position to Deng Xiaoping and China in the early 1990s – i.e. at the brink of the fastest growth rates and biggest transformations in the world
Ray Dalio, Co-founder of Bridgewater Associates
X as at 24 June 2024.
How can we tap into India’s growth?
It is clear that there is plenty of opportunity for growth in India and the hype has a solid basis. The big question is therefore, how can investors benefit from this? Or, more specifically, how can companies access this opportunity?
Ultimately, we think this comes down to the companies and sectors in which they operate being exposed to the structural growth themes and the demographic changes taking place in India. Then it is whether the company has the strategy and ability to take advantage of it.
The store of wealth for India has been relatively consistent in how it is split over time; physical assets, typically property, remain the largest asset allocation in India. However, property has grown only 3.1% annually over the past 10 years, lagging all other asset classes and inflation, which has averaged 3.3% over the same period. Furthermore, equities have led the way with 14.6% annualised growth, followed by gold with 8.0%.6
Chart 4: Indian household wealth by asset class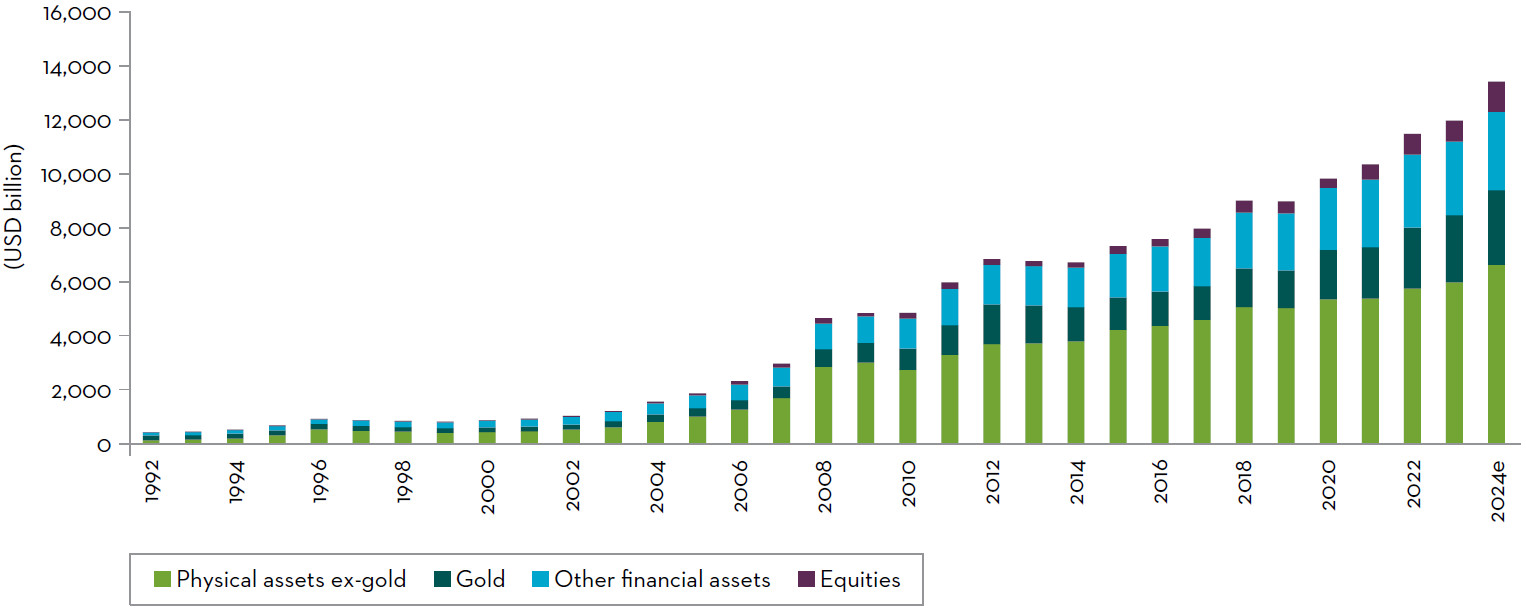
Source: Morgan Stanley Research, RB, WGC, CMIE, NSE. Note all wealth figures are Morgan Stanley estimates. Morgan Stanley Research, India Equity Strategy: The US$10 Trillion Positive Wealth Shock, 11 November 2024.
An opportunity exists for Indian companies whereby the consumer can diversify physical assets (increasing consumption/ consumer spending) and explore more diverse ways to store their wealth (investing in financial products, banking etc.). We believe the two key areas of opportunity for investors in India are in the consumer sector and the financial sector.
The financial sector
India has one of the lowest household debt levels globally among major economies. But what does that mean? It means that compared to other major economies, households have more accessible wealth – cash and other assets. The opportunity for financial sector companies then is how to encourage households to invest their money in the financial system.
Household debt, loans and debt securities (% of GDP)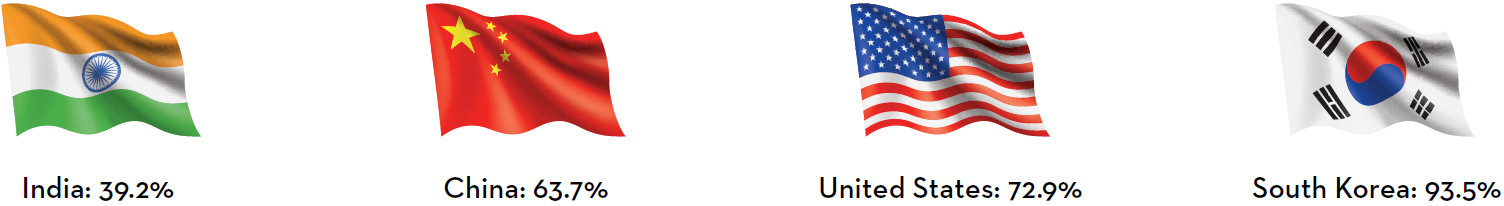
Source: IMF, as at 31 December 2023 (most recent data). Largest MSCI Emerging Market constituent countries with available data shown, United States included for illustrative comparison.
The financial sector has been a key area of growth already, but we believe that there is much more room for growth given the still low household debt levels coupled with the innovation and market leadership we’ve observed in Indian financial sector companies. We think financials can benefit from the following trends:

Urbanisation and the formalisation of India’s economy remain long-term drivers – this has happened regardless of macro and political challenges

Financial services remain underpenetrated due to accessibility – especially for household debt products
Unlike fifteen years ago, digital is now the front and centre of analysis for financial companies, rather than simply an agenda item. Financials have embraced technology, while technology firms themselves have competed with more traditional financials – mobile banking apps enabling penetration into underbanked areas or payment apps integrated with leisure apps are two examples. As technology businesses grow, we can expect future big tech to eat into the profits of the traditional financial sector.
Financials need to innovate and embrace this to compete with the new economy businesses which present a hybrid of financials, technology and telecommunications. Further disruption is found in the impact of demographics on banking customer loyalty and with EM having some of the strongest demographics through young and growing populations, they can be particularly sensitive to change. Indian financials have been particularly agile at adapting to this digital environment, reshaping their businesses to embrace these megatrends rather than combat them.
Case study: leading retail bank
 Quality
- High asset quality and profitability
- Sustainability became a fifth core business value in 2012/2013
 Growth
- Strong loan and deposit growth compared to industry
- Aims to double physical branch network in next 3-5 years
 Opportunity
- Fintech/digital disruption key to strategy – and for accessing an underpenetrated market
- Leading digital capability and strategy allow it to compete favourably with the threat of digital disruption
The consumer sector
India’s consumer sector is vast, diverse, and strongly influenced by its demographics. The country's large, youthful population and its cultural diversity play a significant role in shaping consumer preferences. The rapid adoption of digital technologies has revolutionised retail, enabling businesses to reach a wider audience and adapt to changing consumer demands swiftly.
Like the financial sector, digital disruption has been a key theme in consumer markets, where ecommerce and digital payment systems have seen significant growth, spurred by increased internet penetration and smartphone usage. Additionally, the strong cultural affinity for gold and fine jewellery, particularly during festivals and weddings, ensures sustained demand for these products.
The consumer sector also benefits from the rising middle class and urbanisation; higher disposable incomes have resulted in increased affluence and a greater inclination towards branded and premium products. These unique aspects collectively create a dynamic and rapidly evolving consumer market in India, offering immense opportunities for growth and innovation.
According to estimates from a prominent Indian bank, the shift of affluence will be tremendous with the mix of higher income households growing dramatically.
Chart 5: Distribution of Indian households by annual income, March fiscal year-ends, 2021-2031 estimate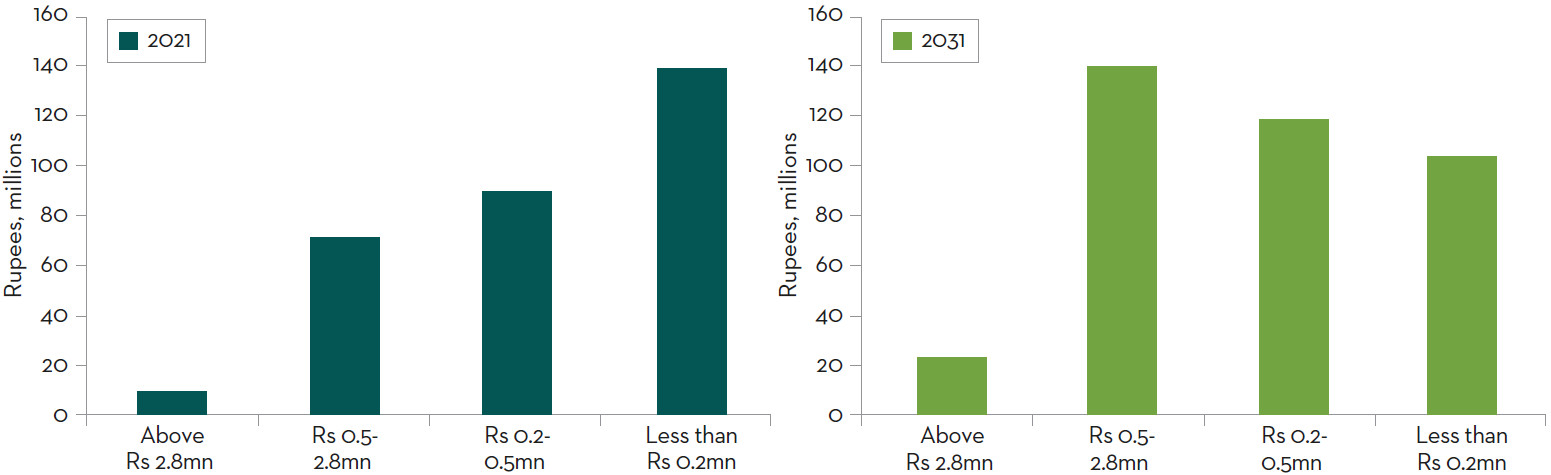
Source: WEF, Kotak Institutional Equities estimates as at 11 February 2024. Kotak Institutional Equities Strategy, FPIs vs DIIs – ‘fight’ to the finish? Rs 2.8m is approximately US$31,000, Rs 0.5m is approximately US$5,800, Rs 0.2m is approximately US$2,300.
Case study: jewellery and watch retailer
Quality
- Market share gains from the increasing formalisation of the market
- Company continues to deliver strong operational results both pre- and post-covid crisis
Growth
- Strong operating profit growth – more than four times the increase in India’s GDP per capita over the period 2010-20237
- Growth in new stores, overseas, and expansion in large categories where historically they have been
underrepresented
Opportunity
- India is a large consumer of gold, second to China with cultural drivers ensuring long-term sustainable demand
- Untapped international opportunity
- Digital disruption through ecommerce and online presence
Attractive opportunities
India remains one of the most attractive investment opportunities in the world and in EM. We see a convergence of positive drivers in India which will continue. As we’ve discussed, the country has attractive demographics and growing incomes. However, we have also seen far-reaching changes to India’s entire economic framework which continue to have positive influence. For instance, over the last few years India has introduced a unified tax structure, a new insolvency and bankruptcy code, and stronger regulation for the real estate industry, to name but a few reforms.
We continue to focus on our key exposure areas such as our active weight in Indian financials as well as our stable of consumption-focused companies to ride the wave of Indian growth. Finally, as we look out to a potential period of political instability regarding global trade and tariff regimes, we expect the Indian economy and stock market to be more defensively positioned as its terms of trade with the US are limited and therefore less exposed to any fall-out from tariff regimes.
Sources
1Source: IMF as at 6 February 2025.
2Source: Company data, RBI. Goldman Sachs Investment Research, The rise of ‘Affluent India’ as at 12 January 2024.
3Source: Government of India. Goldman Sachs Investment Research, The rise of ‘Affluent India’ as at 12 January 2024. Based on tax filings disclosing annual income of over INR 1 million (approximately USD 12,000) between 2017-2022.
4Source: Company data, RBI, Government of India. Goldman Sachs Investment Research, The rise of ‘Affluent India’, 12 January 2024.
5Based on a population size of 1.4 billion people as of 31 December 2023. Source: IMF, 6 February 2025.
6Source: BSE, JLL, Bloomberg, Morgan Stanley Research. Performance as of end CY2023. Morgan Stanley Research, India Equity Strategy: The US$10 Trillion Positive Wealth Shock, 11 November 2024.
7Source: IMF World Economic Outlook (April 2023). Dataset: GDP Per Capita, Current Prices, USD. Sourced: August 7, 2023. Leading jewellery and watch maker company data show projected figures for 2023.
Important Information
This information is issued and approved by Martin Currie Investment Management Limited (‘MCIM’), authorised and regulated by the Financial Conduct Authority. It does not constitute investment advice. Market and currency movements may cause the capital value of shares, and the income from them, to fall as well as rise and you may get back less than you invested.
The information contained in this document has been compiled with considerable care to ensure its accuracy. However, no representation or warranty, express or implied, is made to its accuracy or completeness. Martin Currie has procured any research or analysis contained in this document for its own use. It is provided to you only incidentally and any opinions expressed are subject to change without notice.
This document may not be distributed to third parties. It is confidential and intended only for the recipient. The recipient may not photocopy, transmit or otherwise share this [document], or any part of it, with any other person without the express written permission of Martin Currie Investment Management Limited.
This document is intended only for a wholesale, institutional or otherwise professional audience. Martin Currie Investment Management Limited does not intend for this document to be
issued to any other audience and it should not be made available to any person who does not meet this criteria. Martin Currie accepts no responsibility for dissemination of this document to a person who does not fit this criteria.
The document does not form the basis of, nor should it be relied upon in connection with, any subsequent contract or agreement. It does not constitute, and may not be used for the purpose of, an offer or invitation to subscribe for or otherwise acquire shares in any of the products mentioned.
Past performance is not a guide to future returns.
The distribution of specific products is restricted in certain jurisdictions, investors should be aware of these restrictions before requesting further specific information.
The views expressed are opinions of the portfolio managers as of the date of this document and are subject to change based on market and other conditions and may differ from other portfolio managers or of the firm as a whole. These opinions are not intended to be a forecast of future events, research, a guarantee
of future results or investment advice. There can be no assurance that any prediction, projection or forecast on the economy, stock market, bond market or the economic trends of the markets will be realised.
Some of the information provided in this document has been compiled using data from a representative account. This account has been chosen on the basis it is an existing account managed by Martin Currie, within the strategy referred to in this document.
Representative accounts for each strategy have been chosen on the basis that they are the longest running account for the strategy. This data has been provided as an illustration only, the figures should not be relied upon as an indication of future
performance. The data provided for this account may be different to other accounts following the same strategy. The information should not be considered as comprehensive and additional information and disclosure should be sought.
The information provided should not be considered a recommendation to purchase or sell any particular strategy/ fund/security. It should not be assumed that any of the securities discussed here were or will prove to be profitable.
It is not known whether the stocks mentioned will feature in any future portfolios managed by Martin Currie. Any stock examples will represent a small part of a portfolio and are used purely to demonstrate our investment style. Holdings are subject to change.
Risk warnings – Investors should also be aware of the following risk factors which may be applicable to the strategy shown in this document.
All investments involve risk including the potential for loss.
- Investing in foreign markets introduces a risk where adverse movements in currency exchange rates could result in a decrease in the value of your investment.
- This strategy may hold a limited number of investments. If one of these investments falls in value this can have a greater impact on the strategy’s value than if it held a larger number of investments.
- Smaller companies may be riskier and their shares may be less liquid than larger companies, meaning that their share price may be more volatile.
- Emerging markets or less developed countries may face more political, economic or structural challenges than developed countries. Accordingly, investment in emerging markets is generally characterised by higher levels of risk than investment in fully developed markets.
- The strategy may invest in derivatives Index futures and FX forwards to obtain, increase or reduce exposure to underlying assets. The use of derivatives may result in greater fluctuations of returns due to the value of the derivative not moving in line with the underlying asset. Certain types of derivatives can be difficult to purchase or sell in certain market conditions.
For wholesale investors in Australia:
This material is provided on the basis that you are a wholesale client. MCIM has entered an Intermediary arrangement with Franklin Templeton Australia Limited (ABN 76 004 835 849) (AFSL No. 240827) (FTAL) to facilitate the provision of financial services by MCIM to wholesale investors in Australia. Franklin Templeton Australia Limited is part of Franklin Resources, Inc., and holds an Australian Financial Services Licence (AFSL No. AFSL240827) issued pursuant to the Corporations Act 2001.
For professional investors in Canada.
This material is intended for residents in, or incorporated in, Canada and are a Permitted Client for the purposes of MI 31-103. The information on this section of the website is not intended for use by any other person, including members of the public.
Martin Currie Inc, incorporated in New York with its registered office at 280 Park Avenue, New York, NY 10017 and having a UK branch registered in Scotland (no SF000300), Head office, 5 Morrison Street, 2nd floor, Edinburgh, EH3 8BH, Tel: +44 (0) 131 229 5252 Fax: +44 (0) 131 222 2532 www.martincurrie.com, operates under the International Adviser Exemption with the Ontario Securities Commission (‘OSC’) and is therefore currently not required to be registered as a portfolio manager for the purposes of MI 31-103. Martin Currie Inc. is also authorised by the UK Financial Conduct Authority.
For the avoidance of doubt, nothing excludes, limits or restricts our obligations to you under the UK Financial Services and Market Act 2000, National Instruments or any other applicable law or regulation.
The opinions and views in this website do not take into account your individual circumstances, objectives, or needs and are not intended to be recommendations of particular financial instruments or strategies to you.
This website does not identify all the risks (direct or indirect) or other considerations which might be material to you when entering any financial transaction. You should consult with your professional advisers before undertaking any investment activity. The information provided on this website should not be treated as advice or a recommendation to buy or sell any particular security or other investment. The information on this website has not been reviewed by any competent regulatory authority.
For professional investors:
In the People’s Republic of China:
This document does not constitute a public offer of the strategy, whether by sale or subscription, in the People’s Republic of China (the “PRC”). These strategies are not being offered or sold directly or indirectly in the PRC to or for the benefit of, legal or natural persons of the PRC.
Further, no legal or natural persons of the PRC may directly or indirectly purchase any of the strategy or any beneficial interest therein without obtaining all prior PRC’s governmental approvals that are required, whether statutorily or otherwise. Persons who come into possession of this document are required by the issuer and its representatives to observe these restrictions.
In Hong Kong:
The contents of this document have not been reviewed by any regulatory authority in Hong Kong. You are advised to exercise caution in relation to the offer. If you are in any doubt about any of the contents of this document, you should obtain independent professional advice.
In South Korea:
This document is for information purposes only. It is prepared and presented to provide an introduction to the business of MCIM and its related companies (collectively known as ‘Martin Currie’). This document does not constitute an offer to sell or a solicitation of any offer to invest in any security, fund or other vehicle managed or advised by Martin Currie.
None of the security(ies), fund(s) or vehicle(s) managed by or advised by Martin Currie are registered in South Korea under the Financial Investment Services and Capital Markets Act of Korea and accordingly, none of these instruments nor any interest therein may be offered, sold or delivered, or offered or sold to any person for re-offering or resale, directly or indirectly, in South Korea or to any resident of South Korea except pursuant to applicable laws and regulations of South Korea.
Martin Currie is not registered with or regulated by any regulatory authorities in South Korea.